Silver Price Forecast: $55.61 Triangle Floor Weaponized as Green-Tech Deficit Battles Post-Treaty Energy Crash
Global commodity derivatives are in the midst of a violent structural reset that requires all alternative hard asset classes to withstand...
Quick overview
- Global commodity derivatives are experiencing a structural reset, with spot silver recently finding a floor at $57.53/t oz amid short-term valuation compression.
- The implementation of the U.S.-Iran peace agreement has led to a decline in safe-haven demand for precious metals, contributing to lower oil prices and reduced geopolitical risk.
- The Federal Reserve's restrictive monetary policy under Chair Warsh is driving up interest rates and impacting capital markets, while a significant silver supply deficit persists.
- Technical analysis indicates that silver is in an oversold condition, suggesting potential for short covering and a tactical long position strategy around the $55.61 support level.
Global commodity derivatives are in the midst of a violent structural reset that requires all alternative hard asset classes to withstand very short-term valuation compression. On Thursday 25 June 2026 spot silver (XAG/USD) underwent a long lasting intraday flush trade during the morning session, finding a tentative floor of $57.53/t oz (+0.47%). Industrial procurement desks and longer term capital allocation teams are now conducting very specific block buying orders at specific localised price levels in order to set a bottom for paper price action as speculative short positions unwind.
Islamabad MOU Eases Maritime Shipping and Deflates Safe-Haven Premium
The most critical fundamental driving short term sell side pressure in the precious metals space is the growing implementation of the U.S. and Iran interim peace agreement known as the “Islamabad Memorandum Of Understanding”.
Since the formal cross border signing of the agreement in Switzerland on 19 June commercial marine shipments through the strategic Hormuz Strait are cooling rapidly and shipping capacity is now approaching 85% of historical seasonal levels.
This has resulted in a significant decline in front month benchmarks, with Brent crude oil now trading below $73/barrel, leading to a marked reduction of the near-term war fear premium embedded in a series of paper commodity futures over the first half of Q2 2026. While the geopolitical peace has been a key factor in the softening of short term safe haven flows this also provides some structural relief to global manufacturing costs in Asia and Europe.
The Warsh Doctrine Hardens Capital Carrying Costs
Any near term recovery effort in non-yielding assets was capped by the extremely restrictive monetary policy that was implemented by the Federal Open Market Committee (FOMC) at its meeting of 16 to 17 June. This policy represents the first formal implementation of Federal Reserve Chair Kevin Warsh and the new direction of the Fed. In reaction to persistent sticky consumer inflation where core CPI sits at 4.1% Warsh implemented an extremely strict monetarist policy framework that removed any dovish forward guidance and expectations for any rate cuts in the latter half of 2026.
Interest rates remain at their peak and the Summary of Economic Projections (SEP) dot plot was shifted higher indicating expectations for additional increases in interest rates. This has driven real US bond yields and the U.S. Dollar Index (DXY) to multi month high yields and exchange rate levels.
As a result this is driving deleveraging activity in paper markets at the current level as global capital markets await the next round of PMI manufacturing data.
Six-Year Physical Shortfall Challenges Solar Panel Thrifting
The divergence between short term paper price movements and long term physical supply continues to be the critical anchor of the silver commodity market. The Silver Institute recently updated their global supply/demand report which now indicates an estimated 46.3 million t oz. silver supply deficit in 2026. This will be the sixth year in a row of supply shortage.
Given the fact that nearly 72% of global mining production is tied to by-product processing from primary mining operations in copper, zinc and lead it will not be possible to increase output in a very near term cycle. Industrial applications for silver in computer hardware, artificial intelligence chip manufacturing and 5G technology continue to increase.
However, some recent paper trading desks are now noticing that the increase in the price of spot silver earlier this year could be contributing to an estimated 19% contraction in year over year usage of silver in the solar PV energy market. This decrease in industrial demand and substitution has provided short term buying pressure and has given the bears a window of opportunity to sell the commodity at a discount.
Technical Analysis: XAGUSD Tests Descending Triangle Floor in Stretched Over-Sold Territory
Changing gears from Federal Reserve projections we can now look at the 4h timeframe technical chart of silver. XAG/USD is now approaching the lower boundaries of its recent corrective phase which has established a strong descending triangle consolidation.
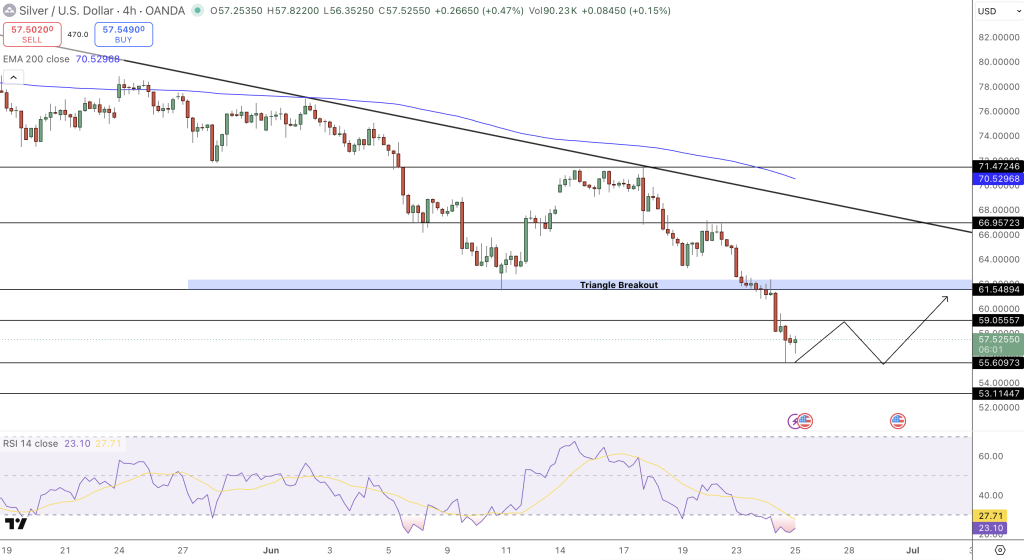
The price action is currently trading right on the lower horizontal line support at $57.53 as the 4 hour trend indicator 200 period exponential moving average (EMA200) sits above at $70.53.
The RSI (14) oscillator is now at a very deep oversold reading of 23.10. This indicates that the short term price decline is likely exhausted. Meanwhile MACD is also stabilizing which indicates this is now a very oversold trading range.
Conclusion and Trade Idea
We conclude that silver commodity prices are now undergoing a very rapid price correction in reaction to a fading geopolitical premium and the new hawkish Fed policy framework led by Chair Warsh that has made global capital expensive and tight.
However, the longer term fundamentals are still in a 46.3 million ounce supply shortage and the 4h timeframe technical charts show a deep oversold market which suggests there will be significant short covering in the near term.
Tactical Short Term Trade Strategy: Wait for a confirmation of short covering to initiate long positions off the 4h time frame descending triangle support level at $55.61. Place a hard stop loss at $53.11 and look to target the top of the descending triangle resistance at $59.06 with second objective targets at $61.55.
- Check out our free forex signals
- Follow the top economic events on FX Leaders economic calendar
- Trade better, discover more Forex Trading Strategies
- Open a FREE Trading Account
- Read our latest reviews on: Avatrade, Exness, HFM and XM
Related Articles

Sidebar rates
Related Posts
