GameStop (GME) Price Prediction: Death Cross Signals More Downside, Key Support at $19.50
Quick overview
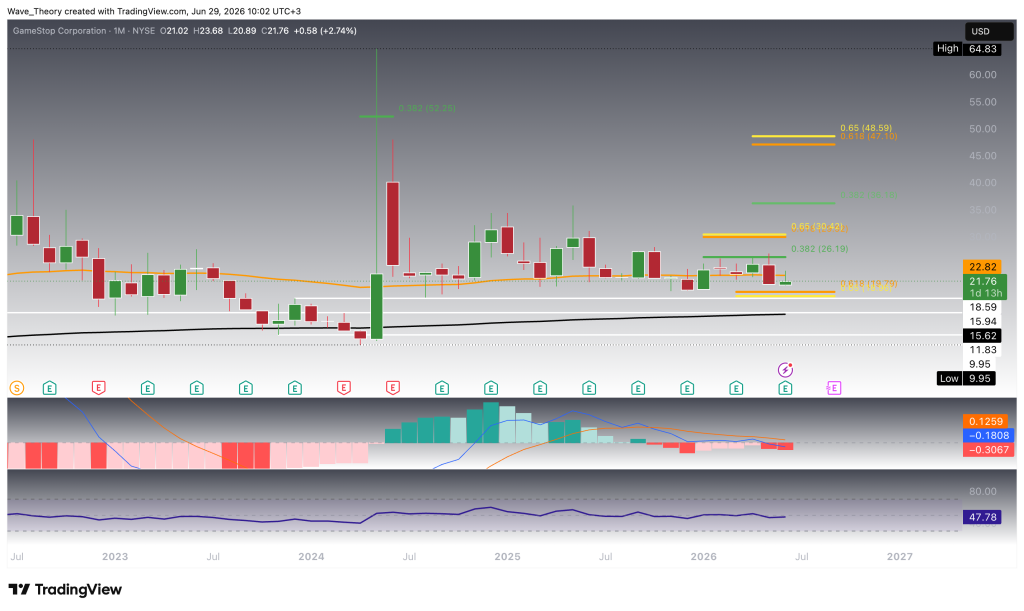
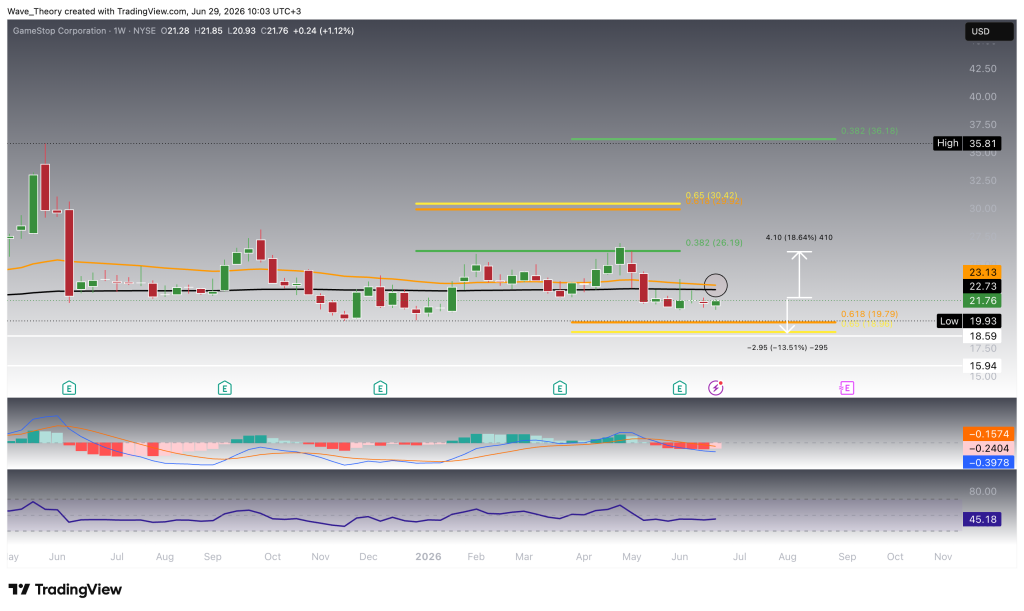
- GameStop (GME) is currently in a prolonged consolidation phase, struggling to break above the 0.382 Fibonacci resistance at $26.20.
- The stock has recently broken below the 50-month EMA at $22.82, increasing the likelihood of further downside, with major support at $19.00.
- Despite some signs of improving short-term momentum, the overall technical structure remains bearish, with a death cross confirmed on multiple timeframes.
- To shift the trend towards bullish, GME must reclaim key resistance levels, particularly the 0.382 Fibonacci resistance at $26.20.
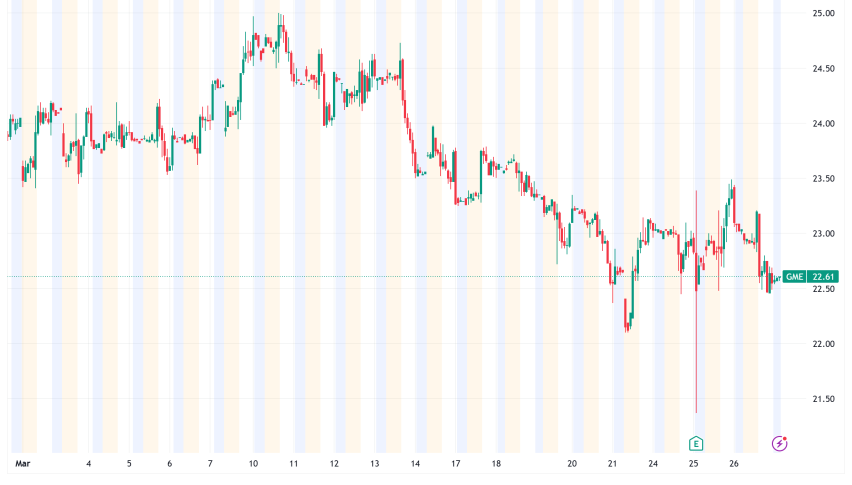
After months of sideways price action, GameStop (GME) remains trapped in a prolonged consolidation phase. The stock has been in a broader downtrend since mid-2024, leaving investors wondering whether the recent stability marks a base for recovery or simply a pause before the next move lower.
GameStop Stock (GME) Faces Bearish Rejection at the 0.382 Fibonacci Resistance
GameStop (GME) held above the 50-month EMA at $22.82 for three consecutive months before losing momentum in May. Despite this resilience, the stock failed to overcome the 0.382 Fibonacci resistance at $26.20, where sellers regained control.
Over the past two months, GME has faced repeated bearish rejection at this resistance level. The subsequent breakdown below the 50-month EMA at $22.82 increases the probability of continued downside in the near term.
The next major support lies at the golden ratio Fibonacci level near $19.00, which could trigger a bullish rebound if buyers step in. Below that, a strong support zone extends between $16.00 and $18.60. This area is further reinforced by the 200-month EMA at $15.62, providing an additional layer of long-term support.
Technical indicators currently paint a mixed picture with a slight bearish bias. The MACD lines have completed a bearish crossover, while the MACD histogram has continued to decline since last month, reflecting weakening momentum. Meanwhile, the RSI remains in neutral territory, indicating neither overbought nor oversold conditions. At the same time, the EMAs continue to maintain a long-term golden crossover, confirming that the broader trend remains structurally bullish despite the recent correction.
The broader downtrend remains intact unless GameStop decisively breaks above the 0.382 Fibonacci resistance at $36.20 and subsequently clears the golden ratio Fibonacci resistance at $48.50. Only a sustained move above these key resistance levels would invalidate the current bearish market structure and signal the beginning of a new long-term bullish trend.

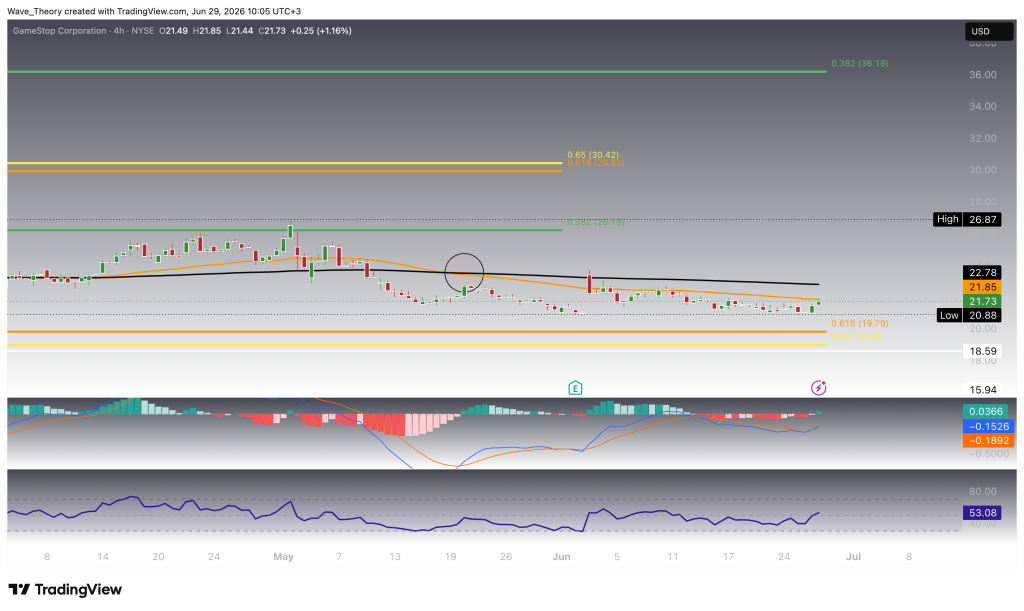
Death Cross Threatens the Weekly Trend
On the weekly chart, the EMAs are close to forming a death cross, which would confirm a bearish trend reversal in the medium term. Momentum indicators also lean bearish, as the MACD lines remain bearishly crossed. However, the MACD histogram has started to tick higher this week, suggesting that bearish momentum is beginning to fade.
Meanwhile, the RSI remains in neutral territory, providing no clear directional signal.
To the upside, GameStop has approximately 19% potential before reaching the 0.382 Fibonacci resistance at $26.20. A confirmed breakout above this level would expose the next major Fibonacci resistance at $30.00.
On the downside, the stock has around 13.5% downside potential before reaching the significant golden ratio Fibonacci support at $19.50, which could serve as a strong demand zone.

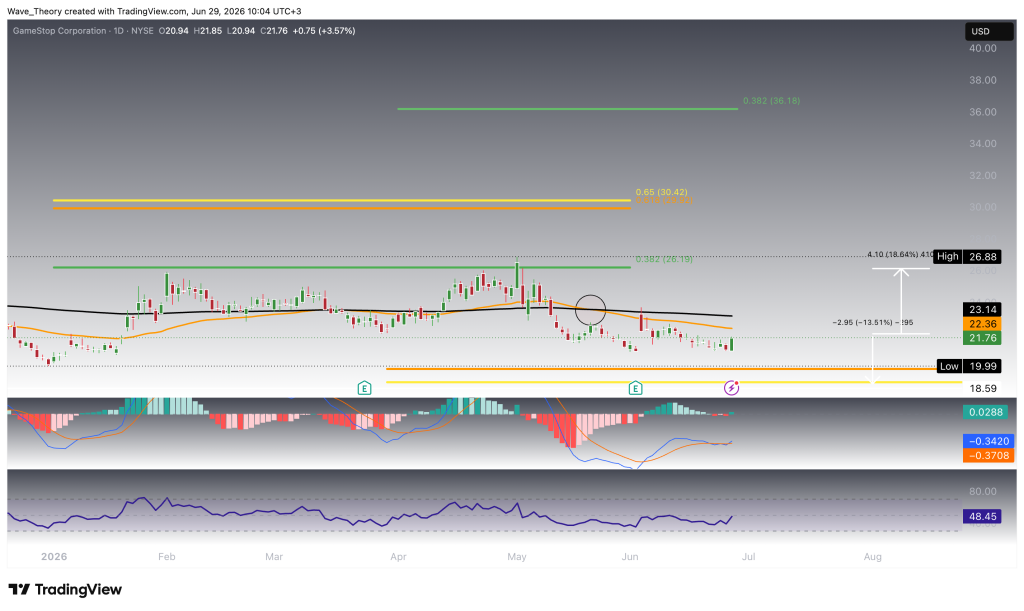
Death Cross Confirmed on the Daily Chart
On the daily chart, the EMAs have already formed a death cross, confirming a bearish trend in the short to medium term. However, momentum is showing early signs of improvement. The MACD lines have completed a bullish crossover, while the MACD histogram continues to tick higher, indicating strengthening bullish momentum.
Meanwhile, the RSI remains in neutral territory, providing no clear directional signal. The mixed indicator setup suggests that, despite the confirmed bearish trend, short-term momentum is beginning to improve.

Death Cross Confirmed on the 4H Chart
On the 4-hour chart, the EMAs have already formed a death cross, confirming a bearish short-term trend. However, momentum is beginning to improve. The MACD lines have completed a bullish crossover, while the MACD histogram continues to tick higher, indicating strengthening bullish momentum.
Meanwhile, the RSI remains in neutral territory, providing no clear directional signal. This mixed indicator setup suggests that, despite the prevailing bearish trend, short-term momentum is gradually improving.
GameStop now faces immediate resistance at the 50-period 4H EMA near $21.85, followed by the 200-period 4H EMA at $22.80. A decisive breakout above both moving averages could shift momentum in favor of the bulls and pave the way for a rally toward the 0.382 Fibonacci resistance at $26.20.

GameStop Stock Forecast Summary
GameStop (GME) remains under pressure after failing to break the 0.382 Fibonacci resistance at $26.20. The rejection triggered a breakdown below the 50-month EMA at $22.82, while the weekly and daily charts continue to favor the bears. Although the MACD has turned bullish on the daily and 4-hour timeframes, suggesting improving short-term momentum, the broader technical structure remains bearish.
On the downside, the first major support lies at the golden ratio Fibonacci level near $19.50. Below that, a strong support zone extends between $16.00 and $18.60, reinforced by the 200-month EMA at $15.62. If this area fails to hold, the next major long-term support zone emerges between $10.00 and $16.00.
To regain bullish momentum, GME must first reclaim the 50-period and 200-period 4H EMAs at $21.85 and $22.80, before challenging the 0.382 Fibonacci resistance at $26.20. A breakout above $26.20 would expose the next major Fibonacci resistance at $30.00.
However, the broader downtrend remains intact unless GameStop decisively breaks above the 0.382 Fibonacci resistance at $36.20 and subsequently clears the golden ratio Fibonacci resistance at $48.50. Only a sustained move above these key resistance levels would invalidate the current bearish market structure and signal the beginning of a new long-term bullish trend.
- Check out our free forex signals
- Follow the top economic events on FX Leaders economic calendar
- Trade better, discover more Forex Trading Strategies
- Open a FREE Trading Account
- Read our latest reviews on: Avatrade, Exness, HFM and XM
