SanDisk Stock Goes Parabolic: Is the Rally Just Getting Started?

Quick overview
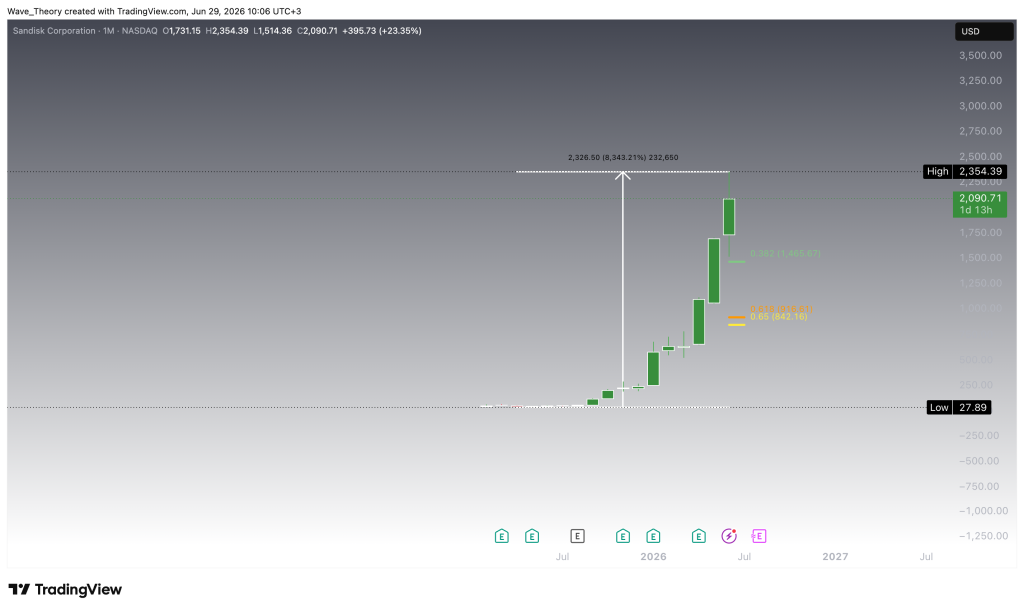
- SanDisk (SNDK) stock has surged over 8,343% in 14 months, reaching an all-time high of $2,354 before entering a corrective phase.
- Despite a recent 21% pullback, the long-term bullish structure remains intact as long as the stock holds above the critical support level of $850.
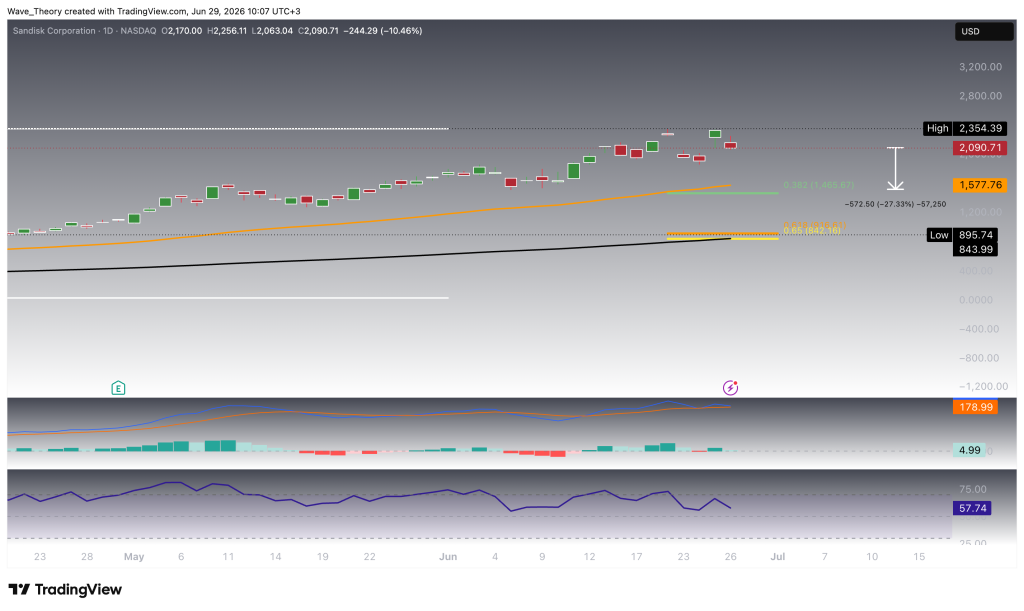
- Bearish divergence on the weekly RSI indicates weakening momentum, while daily indicators still show a predominantly bullish outlook.
- Key support levels to watch include the 50-4H EMA at $1,848 and the 0.382 Fibonacci support at $1,466, with significant downside targets at $850 and $767.
SanDisk (SNDK) stock has staged an impressive rally in recent weeks, breaking above multiple key resistance levels and accelerating into a parabolic uptrend. With bullish momentum continuing to build, investors are now watching whether the stock can sustain its breakout or if a healthy correction is approaching.
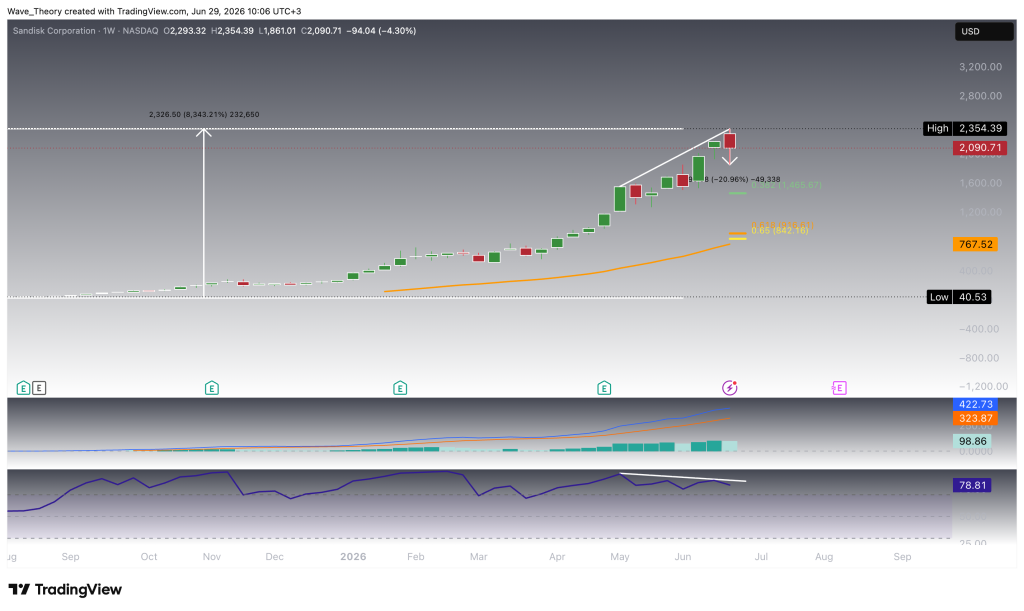
Bearish Divergence Forms on the Weekly RSI
On the weekly chart, SanDisk has started to form a bearish divergence on the RSI, signaling weakening momentum despite the recent uptrend. In line with this development, the stock has already corrected by 21% this week and could extend its decline toward the 0.382 Fibonacci support level at $1,466. If this support fails to hold, the next major downside targets are the golden ratio support at $850 and the 50-week EMA at $767.
Meanwhile, the MACD histogram has continued to tick lower this week, reflecting fading bullish momentum. However, the MACD lines remain bullishly crossed, indicating that the broader uptrend has not yet been invalidated.
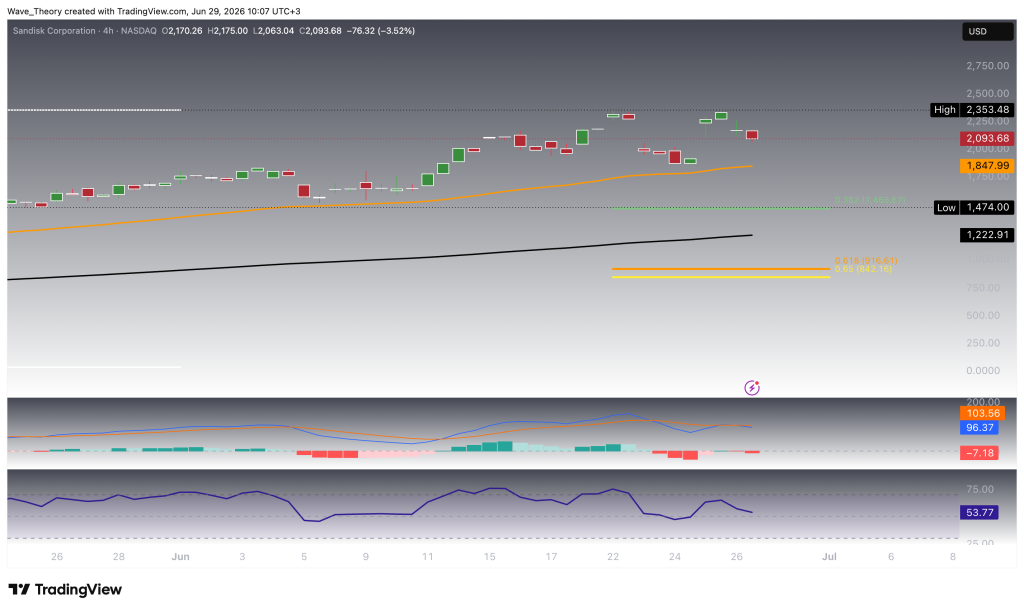
Immediate Support at the 50-4H EMA at $1,848
On the 4-hour chart, the EMAs continue to display a golden crossover, confirming the short-term trend remains bullish. However, the MACD lines have crossed bearishly, while the MACD histogram has started to tick lower, signaling increasing downside momentum. Meanwhile, the RSI remains in neutral territory, leaving room for further price movement in either direction.
If SanDisk (SNDK) extends its corrective phase, the first major support level lies at the 50-period EMA on the 4-hour chart at $1,848. Should this level fail to hold, the next significant support awaits at the 0.382 Fibonacci retracement level at $1,466.
SanDisk (SNDK) Price Prediction: Summary
SanDisk remains in a strong long-term uptrend despite entering a corrective phase after its parabolic rally. While the daily chart continues to favor the bulls, weakening momentum on the weekly timeframe and a bearish RSI divergence suggest the correction could extend further. The first major support lies at the 50-4H EMA at $1,848, followed by the 50-day EMA at $1,578 and the 0.382 Fibonacci support at $1,466. If this level fails, the next key downside targets are the golden ratio support at $850 and the 50-week EMA at $767. As long as SanDisk holds above $850, the broader bullish market structure remains intact.
- Check out our free forex signals
- Follow the top economic events on FX Leaders economic calendar
- Trade better, discover more Forex Trading Strategies
- Open a FREE Trading Account
- Read our latest reviews on: Avatrade, Exness, HFM and XM
Related Articles


Sidebar rates
Related Posts
