Gold Price Forecast: $3,990 Triangle Pivot Under Strain as Safe-Haven Premium Evaporates Against Warsh-Era Dollar
Global precious metals markets are currently locked into a tightly compressed technical equilibrium. This fragile balance is the result...

Quick overview
- Global precious metals markets are experiencing a fragile equilibrium due to geopolitical de-escalation and aggressive monetary tightening in the U.S.
- Spot gold is currently trading around $3,990.26 per troy ounce, with institutional investors taking advantage of the compressed pricing environment.
- The recent U.S.-Iran peace agreement has led to a decline in war premiums, while the Federal Reserve's hawkish stance is impacting non-yielding assets like gold.
- Despite short-term volatility, long-term demand from central banks is providing price support for physical gold.
Global precious metals markets are currently locked into a tightly compressed technical equilibrium. This fragile balance is the result of two competing forces: a rapid pullback in geopolitical war premiums on the one hand, and a severe, aggressive monetary tightening in Washington on the other. During Tuesday, June 30, 2026, spot gold (XAU/USD) found a narrow intraday range during the early trading session, holding steady around $3,990.26 per troy ounce. Major institutional asset managers and sovereign wealth funds are taking advantage of this compressed pricing environment to execute selective, automated accumulation programs, fortifying multi-year defensive positions while short-term futures traders complete their month-end positioning flows.
Swiss Accord Restores Safe Passage Through Hormuz; War Premiums Explode Backward
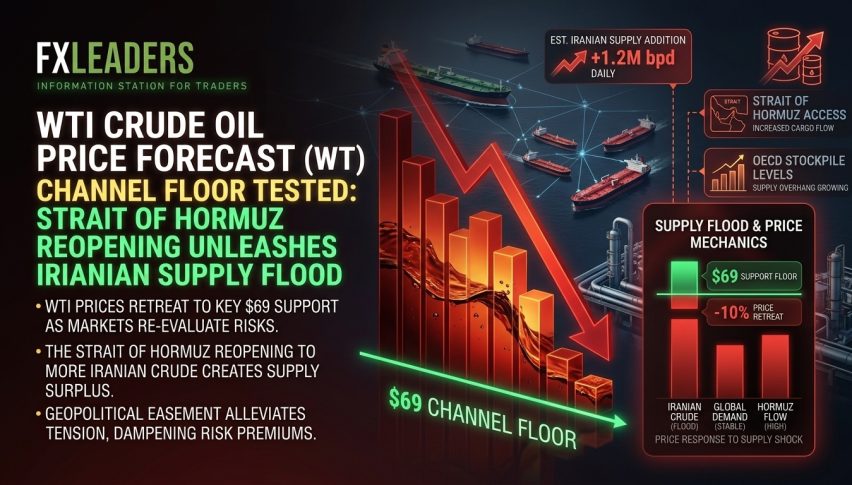
The dominant fundamental driver of the sudden, sharp decline in precious metals has been the fast-moving deployment of the U.S.-Iran Interim Peace Agreement, designated as the “Islamabad Memorandum of Understanding.” Since the formal ceremony in Switzerland on June 19, international shipping corridors via the Strait of Hormuz have been effectively reopened, causing front-month Brent crude futures to crash beneath the $73-per-barrel threshold.
The rapid normalization of global energy logistics has effectively scrubbed the short-term, high-intensity panic premium out of global commodity markets. Nevertheless, strategic global capital allocators remain cautious about escalating short-sell campaigns given the unsettled geopolitical landscape in secondary Middle East conflict zones, preserving gold’s intrinsic value and essential portfolio allocation.
The Warsh Doctrine Locks Down Borrowing Costs for Carry Trades in Non-Income Producing Securities
Limiting any potential technical rebound in other non-correlated assets is the highly aggressive new monetary system implemented at the June 16-17 FOMC policy gathering, signaling the official launch of the Chairmanship of Federal Reserve Chair Kevin Warsh. In response to a persistently hot 4.1% core CPI reading and a 3.8% headline inflation metric, Chair Warsh made swift action to re-anchor market expectations, formally eliminating dovish forward-looking statements and cancelling all projections for interest rate cuts in the autumn. This new “higher for longer” rate regime has effectively underpinned the U.S. Dollar Index (DXY) and the U.S. Treasury real yield, resulting in a massive, sustained bid. Because elevated risk-free rates dramatically increase the opportunity cost of holding non-yielding assets, the paper gold market is currently experiencing a healthy revaluation, pushing spot prices down to fair-value fundamental baselines.
Ongoing Long-Term Currency Diversification Supports Physical Prices
While short-term spot futures desks are reacting in real time to central bank policy announcements, the physical gold market remains largely insulated from the volatility by long-term, institutional buyers who are not driven by price. The People’s Bank of China (PBOC) has officially continued its aggressive and undisclosed gold accumulation campaign for more than 17 straight months. In parallel, a coalition of global central banks in emerging markets continues to systematically rotate their reserve holdings away from G7-denominated debt instruments and toward physical gold as a counterbalance to both exchange rate risks and the weaponization of the global payment system. This continuous, price-agnostic demand from official sector participants serves as a definitive price support, preventing any further significant declines during phases of dollar market strength.
Technical Analysis: XAUUSD Tests Descending Triangle Floor in Stretched Over-Sold Territory
Moving from the Fed Funds dot-plot to the daily price chart, the ongoing multi-month corrective sequence in gold from its previous $5,400 high has brought the chart into a well-defined descending triangle formation. XAU/USD is currently exhibiting a strong technical defense along its primary falling black trendline drawn from the most recent cyclical high.
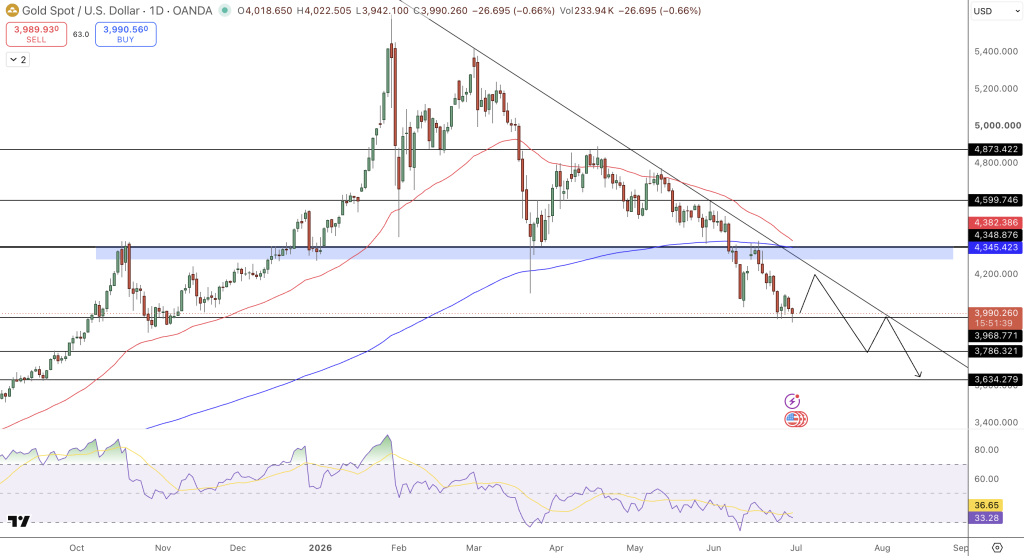
The price is currently defending the floor of this pattern, which shows multiple touches along the floor, with buying absorption evident below the prevailing Daily 200-EMA ($4,348.00) support zone. The 14-period RSI is now fully stretched, now trading inside the deep oversold zone at 36. This extreme level of technical pressure suggests that short-term momentum has bottomed, while early signs of stabilization in the MACD histogram imply that we are in a deeply compressed, coiled base that could support a technically meaningful mean reversion rebound.
Final Thoughts and Trade Plan
Spot gold is currently undergoing a necessary technical correction in the wake of significant geopolitical de-escalation and the Federal Reserve’s recent pivot to a more hawkish policy stance. Though Chairman Warsh’s hardline approach to interest rate policy will keep borrowing costs relatively expensive for the foreseeable future, the reality of a 17-month sovereign buying spree guarantees that the metal will remain a fundamentally secure asset. Short-Term Technical Trade: Initiate a buy position only after a confirmed daily candle closes above the $4,091.00 resistance zone, and place a protective stop-loss below the multi-week low of $3,900.00, aiming first for the descending trendline at $4,157.00 and subsequently for $4,222.00.
- Check out our free forex signals
- Follow the top economic events on FX Leaders economic calendar
- Trade better, discover more Forex Trading Strategies
- Open a FREE Trading Account
- Read our latest reviews on: Avatrade, Exness, HFM and XM
Related Articles

Sidebar rates
Related Posts
