Ethereum Price Forecast: $1,509 Support Line Exposed as L2 Fee Cannibalization Drives ETH/BTC Ratio to 10-Month Low
A heavy, multi-day distribution pressure from the institutional crowd is weighing on the infrastructure of the key layer-1 smart contract...

Quick overview
- Ethereum is experiencing downward pressure due to a heavy distribution from institutional investors and a prolonged ETF net outflow period.
- The delayed Glamsterdam upgrade and the rise of Layer 2 rollups have negatively impacted Ethereum's transaction fees and overall market position.
- The Federal Reserve's restrictive yield policies under Chair Kevin Warsh are contributing to a challenging macroeconomic environment for Ethereum.
- Technical analysis indicates that Ethereum is in a bearish descending channel, with potential for a tactical rebound if it holds above key support levels.
A heavy, multi-day distribution pressure from the institutional crowd is weighing on the infrastructure of the key layer-1 smart contract networks as long-term milestones compete for attention with short-term rebalancing driven by macro factors. On Tuesday, June 30, 2026, in the midst of an afternoon sell-off, Ethereum (ETH/USD) was down -1.31% across the past 24 hours to change hands at $1,571.91.
As the month ends, big money players and ETF market makers are trying to defend their local liquidity pools to offset on-chain liquidations amid changing market dynamics and a tough macro landscape.
L2 Fee Cannibalization and Glamsterdam Delay Exacerbate Relative Decline
The biggest fundamental driver behind ETH’s relative weakness is a structural change in its native on-chain economy. Despite Ethereum still having the largest Total Value Locked (TVL) in DeFi, the rise of Layer 2 rollups, specifically with higher on-chain volume, has eaten into its layer-1 transaction fees.
After the blob space was activated with earlier upgrades, Ethereum transactions have shifted away from layer 1 to L2s. This has put downward pressure on the burn rate via EIP-1559 and dampens ETH’s structural deflationary thesis.
The next upgrade for the network, dubbed Glamsterdam, was delayed to the second half of 2026. Glamsterdam was expected to raise the maximum TPS throughput for the network to 10,000 and decrease transaction costs an additional 78.6%.
With a later-than-expected upgrade, high-TTP layer-1s and other L2 protocols in ecosystems like Solana are now able to grab the lion’s share of speculative activity, which drives increased MEV (maximal extractable value). Since then, the ETH/BTC ratio has dropped -22.33% in the last six months to a 10-month low at 0.027, well below the 200-week moving average.
Spot Prices Pressured by ETF 17-Day Drift on Friday
As ETH’s cross-asset market continues to lose value, Ethereum’s spot prices are under pressure from structural flow disparities in regulated markets. While spot Bitcoin ETFs have built up hundreds of millions of dollars in reserves, spot ETH ETFs went for 17 straight days of net outflows, wiping out $708 million from popular ETFs like ETHA and FETH.
The extended redemption streak came to a brief halt in the middle of June, but institutional de-risking remains underway. On the June 26 session alone, Ethereum spot ETFs suffered single-day net outflows of $13 million. Given the steady drain of institutions, ETF managers are cutting back their exposure to the platform narrative, which is holding ETH quotes near-term inside a correction.
Warsh Doctrine Maintains Conventional Yield Headwinds
Another factor is the restrictive stance on yields by the Fed, which was confirmed at the June 16 and 17 Federal Open Market Committee meeting, the historic first day as Federal Reserve chairman, Kevin Warsh. As underlying consumer price measures remained sticky, with core CPI at a stubborn 4.1% and headline inflation at 3.8%, Chair Warsh put into effect a stringent data-dependent monetarist playbook that eliminated any vestiges of dovish legacy forward guidance as well as autumn rate-cut anticipation.
By locking the benchmark interest rate at its cycle peak and pushing out future interest-rate trajectory, the Warsh Fed has effectively brought U.S. Treasury real yields, as well as the U.S. Dollar Index (DXY), to new cyclical highs for multi-months. The increased cost of capital is imposing a heavy carrying cost on paper derivatives, and systematic index deleveraging is taking place, while the marketplace awaits a fresh reading of the manufacturing PMI later in the quarter.
Alongside these developments is the formal adoption of the U.S.-Iran interim peace pact (the “Islamabad Memorandum of Understanding”), which was signed in Switzerland. The smooth reopening of global sea-lanes, via the Hormuz, has driven crude oil down toward $70, and is thereby sapping the inflation-hedging value of these oil geopolitical tensions for capital rotated into alternative store-of-value classes.
Ethereum Technical Analysis: ETHUSD Squeezes into an Enduring 2H Descending Channel Base
Moving from central bank interest rate directives, Ethereum’s multi-week selling leg has driven price into a very mature, bearish, descending channel on the 2-hour chart.
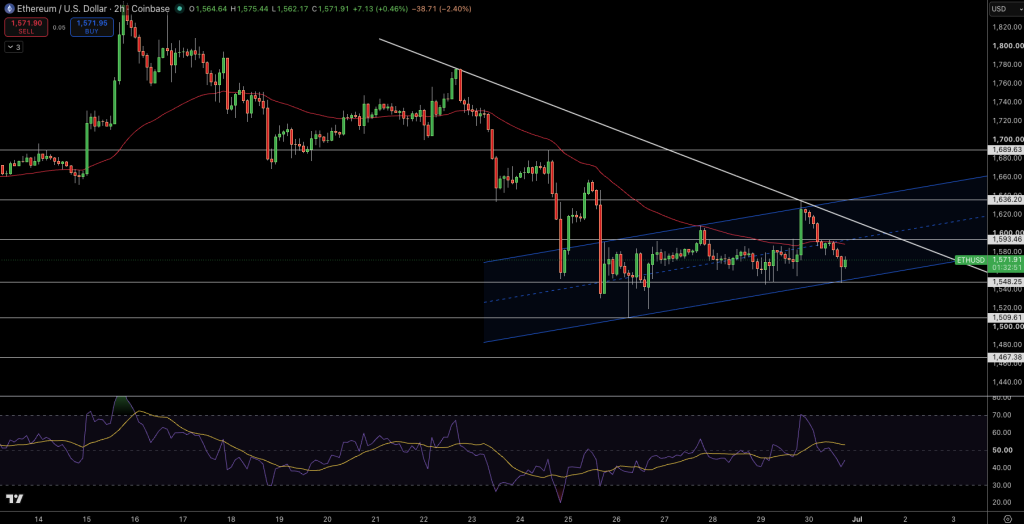
The digital currency has made a string of lower lows and lower highs for a price of $1,571.91, after experiencing another retest of its upper boundary. Price is currently probing a significant local demand node immediately above a dynamic, ascending blue trendline support floor of $1,509.00, and is also well below its trailing macro-level resistance.
The 14-period RSI has flattened out to print a neutral-bullish reading at 61, meaning that recent bear selling pressure appears to be waning, with there not being any bearish divergences on this timeframe at the moment. The flattening is also confirmed by early flattening of the MACD lines, suggesting an equally compressed market structure that is primed for a rapid, tactical, short-exit rally as month-end approaches.
Conclusion and Trade Idea
Ethereum remains dominant in its smart contract usage footprint and staking base, as well as its long-term Layer-2 expansion plans. However, the fact that its recent ETF net outflow period has lasted for 17-days, that the highly anticipated Glamsterdam upgrade has taken an extended time, and that we are in a high-carry environment for Federal Reserve Chair Kevin Warsh, means that any rally to key technical supply zones will continue to meet institutional resistance.
Tactical Rebound Blueprint
Look to execute long positions on verified 2-hour candlestick validation and bounce from the core ascending trendline support floor at $1,509.00, targeting a break above immediate resistance at $1,593.00. Maintain an explicit stop-loss order below the significant horizontal support invalidation level at $1,509.00, targeting the short-exit price move higher to the next significant horizontal supply node at $1,689.00, and eventually to the upper channel resistance zone at $1,700.00.
- Check out our free forex signals
- Follow the top economic events on FX Leaders economic calendar
- Trade better, discover more Forex Trading Strategies
- Open a FREE Trading Account
- Read our latest reviews on: Avatrade, Exness, HFM and XM
Related Articles


Sidebar rates
Related Posts
Ava

