The 100 Weekly SMA Continues to Act as Support for Bitcoin
Bitcoin reversed to bearish in Q2 and lost half it's value from the highs in June. But the 100 weekly SMA has held the decline for weeks
Cryptocurrencies have been extremely volatile in the last three year, especially if we look at larger time-frame charts such as the weekly chart. BITCOIN surged in 2017 and got pretty close to $20,000 by the end of the year, having started 2017 below $1,000.
But, the “gold rush” for altcoins ended towards the end of December and 2018 was a really bad year for digital currencies. Bitcoin ended up giving 80% of its gains and fell to $3,000. It traded between that level at the bottom and $4,00 during Q1 of this year.
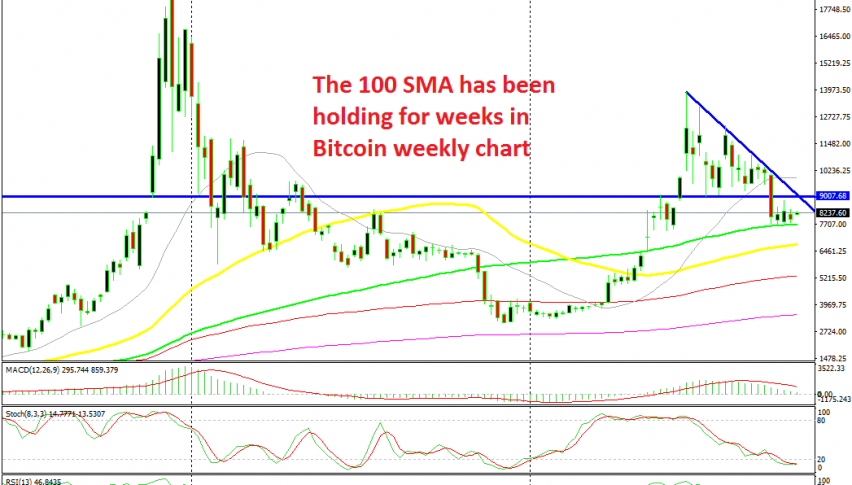
But, buyers came back in Q2 and Bitcoin surged higher again, getting pretty close to $14,000. Although, the climb stopped right there and during Q3 we have seen cryptocurrencies retrace lower. Whether this is a retrace before the next bullish move or a reversal,it remains to be seen, but for the moment the decline has stopped right at the 100 SMA (green) on the weekly chart.
This moving average has been providing solid support in the last four weeks and the stochastic indicator is now oversold, which means that the retrace lower is complete. This chart setup points to a bullish reversal soon. So, I am considering going long on Bitcoin, but will see if we can get a better entry point lower, closer to the 100 SMA which stands around $500 lower at $7,700.
- Check out our free forex signals
- Follow the top economic events on FX Leaders economic calendar
- Trade better, discover more Forex Trading Strategies
- Open a FREE Trading Account
- Read our latest reviews on: Avatrade, Exness, HFM and XM
Related Articles


Sidebar rates
Related Posts
