Prices Forecast: Technical Analysis
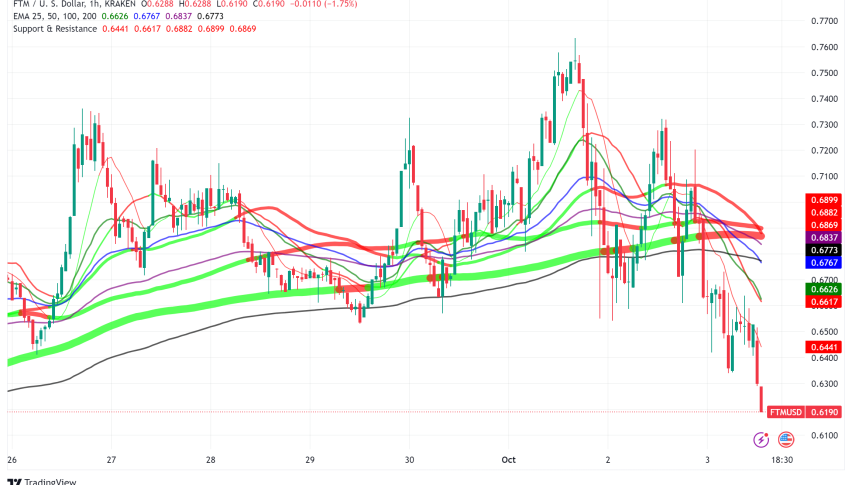
For the daily forecast, Fantom is expected to close around $0.70, with a potential range between $0.69 and $0.71. The weekly forecast suggests a closing price of approximately $0.71, with a range from $0.68 to $0.72. The technical indicators provide a mixed picture; the Parabolic SAR indicates a short trend reversal, suggesting potential upward momentum. However, the lack of data on RSI, ATR, and MACD limits the ability to gauge momentum and volatility accurately. The pivot point at $0.70 serves as a critical level, with the asset currently trading near this point, indicating a neutral stance. The economic calendar shows a slight increase in jobless claims, which could impact market sentiment and indirectly affect Fantom’s price through broader market movements.
Fundamental Overview and Analysis
Fantom’s recent price trend shows a slight decline from $0.7188 to $0.6977, reflecting a cautious market sentiment. Factors influencing its value include technological advancements in blockchain scalability and potential regulatory changes. Investor sentiment appears cautious, with trading volumes decreasing, suggesting a wait-and-see approach. Opportunities for growth lie in Fantom’s scalability and potential adoption in decentralized finance (DeFi). However, risks include competition from other blockchain platforms and market volatility. Currently, Fantom seems fairly priced, given its technological potential and market position. The asset’s valuation will depend on its ability to maintain technological leadership and navigate regulatory landscapes.
Outlook for Fantom
Fantom’s future outlook is cautiously optimistic, with potential developments in DeFi and blockchain technology driving interest. Current market trends show a consolidation phase, with historical price movements indicating a potential for breakout. Economic conditions, such as jobless claims, could influence broader market sentiment, impacting Fantom indirectly. In the short term (1 to 6 months), Fantom may experience moderate growth, with prices potentially reaching $0.72. Long-term forecasts (1 to 5 years) depend on technological advancements and market adoption, with potential for significant appreciation if these factors align. External events, such as regulatory changes or technological breakthroughs, could significantly impact Fantom’s price trajectory.
Technical Analysis
Current Price Overview: Fantom’s current price is $0.6977, slightly down from the previous close of $0.6987. Over the last 24 hours, the price has shown minor fluctuations, indicating low volatility and a lack of strong directional movement. Support and Resistance Levels: Key support levels are at $0.69, $0.69, and $0.68, while resistance levels are at $0.70, $0.71, and $0.71. The pivot point is $0.70, with Fantom trading just below it, suggesting a neutral to slightly bearish sentiment. Technical Indicators Analysis: With no RSI, ATR, or ADX data available, trend strength and volatility assessments are limited. The absence of 50-day SMA and 200-day EMA data prevents analysis of moving average crossovers. Market Sentiment & Outlook: Sentiment appears neutral, with price action hovering around the pivot. The lack of RSI and ADX data limits trend analysis, while low volatility suggests a wait-and-see market approach.
Forecasting Returns: $1,000 Across Market Conditions
The table below outlines potential returns on a $1,000 investment in Fantom under various market scenarios. In a Bullish Breakout scenario, a 10% price increase could raise the investment to approximately $1,100. In a Sideways Range, the price might remain stable, keeping the investment around $1,000. In a Bearish Dip, a 10% decrease could reduce the investment to about $900. These scenarios highlight the importance of market conditions in determining investment outcomes. Investors should consider their risk tolerance and market outlook when deciding to invest in Fantom. Diversification and regular market monitoring are recommended to manage potential risks effectively.
| Scenario | Price Change | Value After 1 Month |
|---|---|---|
| Bullish Breakout | +10% to ~$0.77 | ~$1,100 |
| Sideways Range | 0% to ~$0.70 | ~$1,000 |
| Bearish Dip | -10% to ~$0.63 | ~$900 |
FAQs
What are the predicted price forecasts for the asset?
The daily forecast for Fantom suggests a closing price around $0.70, with a range between $0.69 and $0.71. The weekly forecast anticipates a closing price of approximately $0.71, with a range from $0.68 to $0.72.
What are the key support and resistance levels for the asset?
Key support levels for Fantom are at $0.69, $0.69, and $0.68. Resistance levels are identified at $0.70, $0.71, and $0.71. The pivot point is $0.70, with the asset currently trading near this level.
What are the main factors influencing the asset’s price?
Fantom’s price is influenced by technological advancements in blockchain, regulatory changes, and market sentiment. Economic indicators, such as jobless claims, can also impact broader market conditions, indirectly affecting Fantom’s price.
What is the outlook for the asset in the next 1 to 6 months?
In the short term, Fantom may experience moderate growth, with prices potentially reaching $0.72. Market conditions, technological developments, and regulatory changes will play crucial roles in shaping its price trajectory.
Disclaimer
In conclusion, while the analysis provides a structured outlook on the asset’s potential price movements, it is essential to remember that financial markets are inherently unpredictable. Conducting thorough research and staying informed about market trends and economic indicators is crucial for making informed investment decisions.