Prices Forecast: Technical Analysis
For today, SushiSwap is predicted to close at approximately $0.205, with a range between $0.200 and $0.210. Looking ahead to the week, the expected closing price is around $0.207, with a potential range of $0.202 to $0.212. The technical indicators suggest a cautious outlook, as the RSI is currently at 45.84, indicating a neutral trend, while the ATR of 0.0156 suggests low volatility. The price has been oscillating around the pivot point of $0.21, which is a critical level for determining future movements. If the price can hold above this pivot, it may signal a bullish reversal; however, a drop below could lead to further declines. The support levels at $0.20 and $0.19 provide a safety net, while resistance at $0.21 and $0.22 could cap any upward movements. Overall, the market sentiment appears to be cautious, with traders watching for confirmation of a breakout or breakdown.
Fundamental Overview and Analysis
SushiSwap has recently experienced a decline in price, reflecting broader market trends and investor sentiment. Factors influencing its value include the ongoing developments in decentralized finance (DeFi) and competition from other platforms. Investor sentiment appears mixed, with some viewing SushiSwap as a strong contender in the DeFi space, while others express concerns over its market position. Opportunities for growth exist, particularly with potential partnerships and technological advancements that could enhance its platform. However, risks remain, including regulatory scrutiny and market volatility that could impact trading volumes. Currently, SushiSwap appears to be fairly priced, considering its recent performance and market conditions. Investors should remain vigilant about market dynamics and potential shifts in sentiment.
Outlook for SushiSwap
The future outlook for SushiSwap remains cautiously optimistic, with potential for recovery if market conditions improve. Current trends indicate a consolidation phase, with price movements closely tied to broader market sentiment. In the short term (1 to 6 months), prices may fluctuate between $0.200 and $0.220, depending on market developments and investor interest. Long-term projections (1 to 5 years) suggest that if SushiSwap can innovate and expand its offerings, it could see significant growth, potentially reaching prices above $0.300. However, external factors such as regulatory changes and competition could pose challenges. Investors should monitor these developments closely, as they could significantly impact SushiSwap’s price trajectory.
Technical Analysis
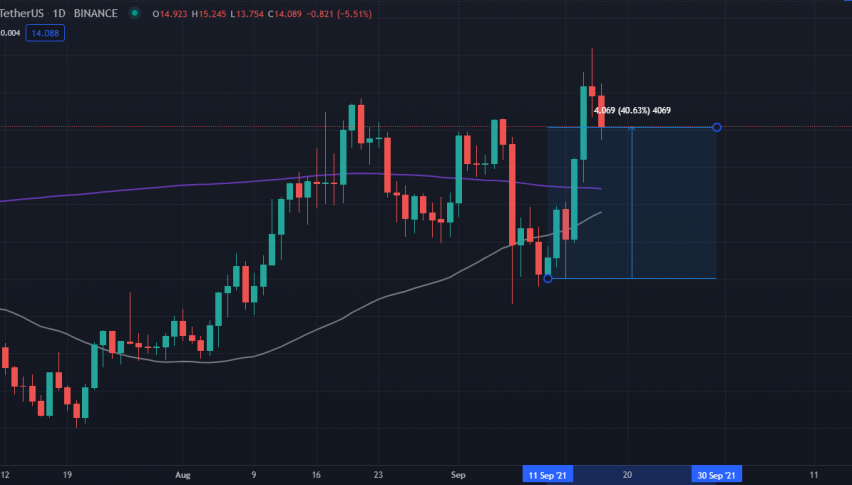
Current Price Overview: The current price of SushiSwap is $0.206, which is a slight decrease from the last closing price of $0.206. Over the last 24 hours, the price has shown minimal volatility, indicating a stable trading environment. Support and Resistance Levels: Key support levels are at $0.20, $0.19, and $0.18, while resistance levels are at $0.21, $0.22, and $0.23. The pivot point is $0.21, and the asset is currently trading just below this level, suggesting a potential for upward movement if it can break through. Technical Indicators Analysis: The RSI is at 45.84, indicating a neutral trend, while the ATR of 0.0156 suggests low volatility. The ADX is at 21.62, indicating a weak trend. The 50-day SMA is at $0.2058, and the 200-day EMA is at $0.2407, showing no crossover at this time. Market Sentiment & Outlook: Sentiment appears neutral, with price action hovering around the pivot point. The RSI indicates a lack of momentum, and the ADX suggests a weak trend, indicating that traders should be cautious.
Forecasting Returns: $1,000 Across Market Conditions
The table below outlines potential investment scenarios for SushiSwap, providing insights into expected returns based on different market conditions.
| Scenario | Price Change | Value After 1 Month |
|---|---|---|
| Bullish Breakout | +10% to ~$0.227 | ~$1,100 |
| Sideways Range | 0% to ~$0.206 | ~$1,000 |
| Bearish Dip | -10% to ~$0.185 | ~$900 |
FAQs
What are the predicted price forecasts for the asset?
The predicted daily closing price for SushiSwap is approximately $0.205, with a range between $0.200 and $0.210. For the weekly forecast, the expected closing price is around $0.207, with a potential range of $0.202 to $0.212.
What are the key support and resistance levels for the asset?
Key support levels for SushiSwap are at $0.20, $0.19, and $0.18. Resistance levels are at $0.21, $0.22, and $0.23, with the pivot point at $0.21.
What are the main factors influencing the asset’s price?
Factors influencing SushiSwap’s price include market sentiment, competition in the DeFi space, and potential regulatory changes. Additionally, technological advancements and partnerships could impact its value.
What is the outlook for the asset in the next 1 to 6 months?
In the short term, SushiSwap’s price may fluctuate between $0.200 and $0.220, depending on market developments. The outlook remains cautiously optimistic, with potential for recovery if market conditions improve.
What are the risks and challenges facing the asset?
Risks facing SushiSwap include regulatory scrutiny, market volatility, and competition from other DeFi platforms. These factors could impact trading volumes and investor sentiment.
Disclaimer
In conclusion, while the analysis provides a structured outlook on the asset’s potential price movements, it is essential to remember that financial markets are inherently unpredictable. Conducting thorough research and staying informed about market trends and economic indicators is crucial for making informed investment decisions.