Support & Resistance Levels – NZD/USD
We have an open forex signal in NZD/USD, as we mentioned in one of our previous market updates. Let´s have a look at the support and resistance levels in this pair:
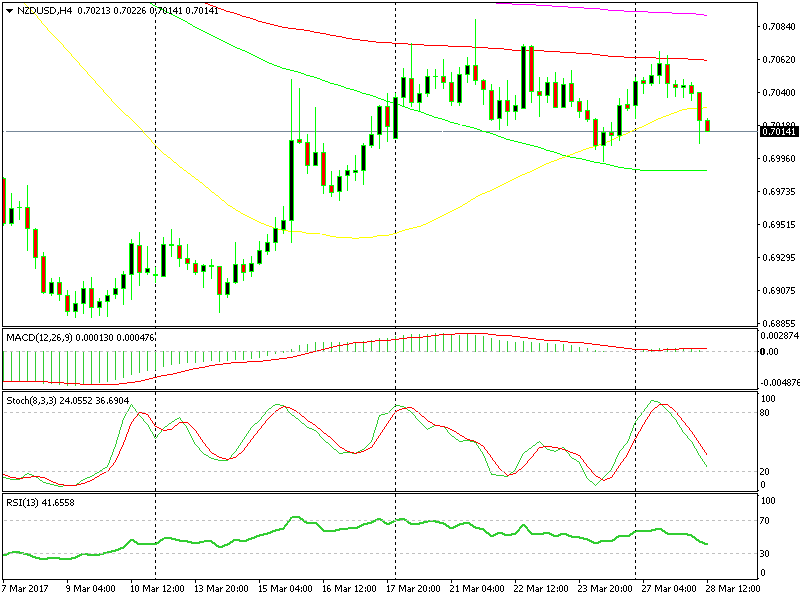
Support – The closest support level comes at around 0.7015; it has been the high and the low several times in the past week or so. 0.70 is obviously a big round level, which held the decline this morning.
The 100 SMA (green) on the H4 chart comes about 10 pips lower, which adds extra strength to the 0.70 level. 0.6950 is another big level, before 0.69. These are the closest support levels, although the pressure is on the topside, so let´s switch to resistance.
 You can see how well moving averages work, sometimes
Resistance – Looking at the hourly forex chart which we posted on our previous NZD/USD update, we can see a number of moving averages coming at 0.7025, 0.7030 and 0.7040. These are all mild resistance levels, apart from 0.7040 which is a “make or break” lever for our forex signal.
This level was providing solid support all day yesterday, but as we said, something changed overnight and the price moved below it, so now it is the level to watch.
Above there we have 0.7060-70, which has been the high for several days and we can also find the 100 SMA (red) on the H4 chart.
That´s followed by 0.790-71.00 where we can find the 200 SMA on the same chart. That´s been the highest level in about a month, so it´s obvious it will be a big hustle for buyers.
- Check out our free forex signals
- Follow the top economic events on FX Leaders economic calendar
- Trade better, discover more Forex Trading Strategies
- Open a FREE Trading Account
- Read our latest reviews on: Avatrade, Exness, HFM and XM
Related Articles


Sidebar rates
Related Posts
