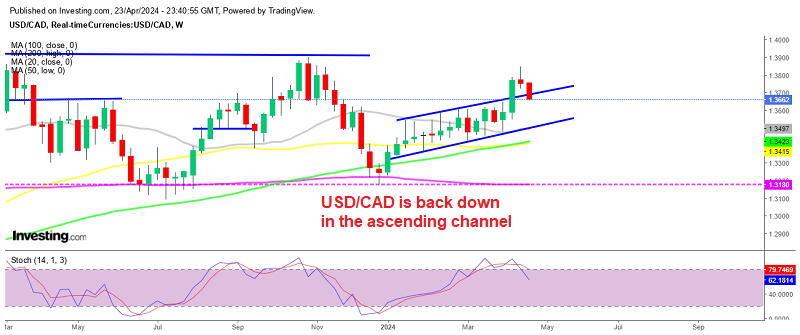
USD/CAD has formed an almost perfect bearish reversing chart pattern. The first weekly candlestick for May closed as a pin, which is a reversing signal. However, the following week, which was supposed to be the bearish one, closed positive, but it didn´t make any lows.
Then, last week, this forex pair finally made a move. We broke below the 1.36 support/resistance level and ended up 200 pips lower for the week.
So, it looks like we lost the chance for a long-term sell signal in this pair. This surge has been a result of two things:
- Broad USD weakness
- Broad Oil strength
Oil has gained about 7 cents in the last two weeks, while the Buck has lost all will to live. Both of these factors have been pushing this forex pair lower over the past two weeks. Nevertheless, this has been going on for too long and a correction is due soon.
 The weekly chart looks pretty bearish
So, we might see a move higher in the coming days, especially since the daily chart is already oversold. 1.3450 might be the turning point, as it has provided resistance before and now it might do the opposite.
But the real worry for shorts is the BOC (Bank of Canada) meeting on Wednesday. The inflation report last Friday missed expectations, while core retail sales declined. If you remember from the last meeting, the BOC was trying to remain dovish/neutral when the economic data was sort of impressive. Now that the data has been disappointing, the BOC might find it easier to be more dovish, which will, of course, send USD/CAD rocketing. It seems we might not have lost the chance for a long-term sell forex signal here.


