WTI Crude Oil – Sideways Pattern Ready to Breakout!
The crude oil continues to trade sideways, maintaining a narrow trading range of $47.20 - $47.60 as trader focus remains on the haven asset
The crude oil continues to trade sideways, maintaining a narrow trading range of $47.20 – $47.60 as trader focus remains on the haven assets. The sideways market is giving us quite a decent trade setup. Let's take a look….
The crude oil prices are narrowly mixed on the back of light trade following a U.S. holiday. Signs that U.S. refineries are coming back online is placing slight pressure on the WTI Crude Oil prices.
Technicals Outlook
On the daily chart, oil has to maintain a sideways trend from $47.20 – $47.60, forming an indecision candles. The 50- periods EMA is near $47.15, suggesting a bullish trend in the oil. The prices are far away from their average prices & should pull back to $47 zone.
 Crude Oil – Hourly Chart – Symmetric Triangle Pattern
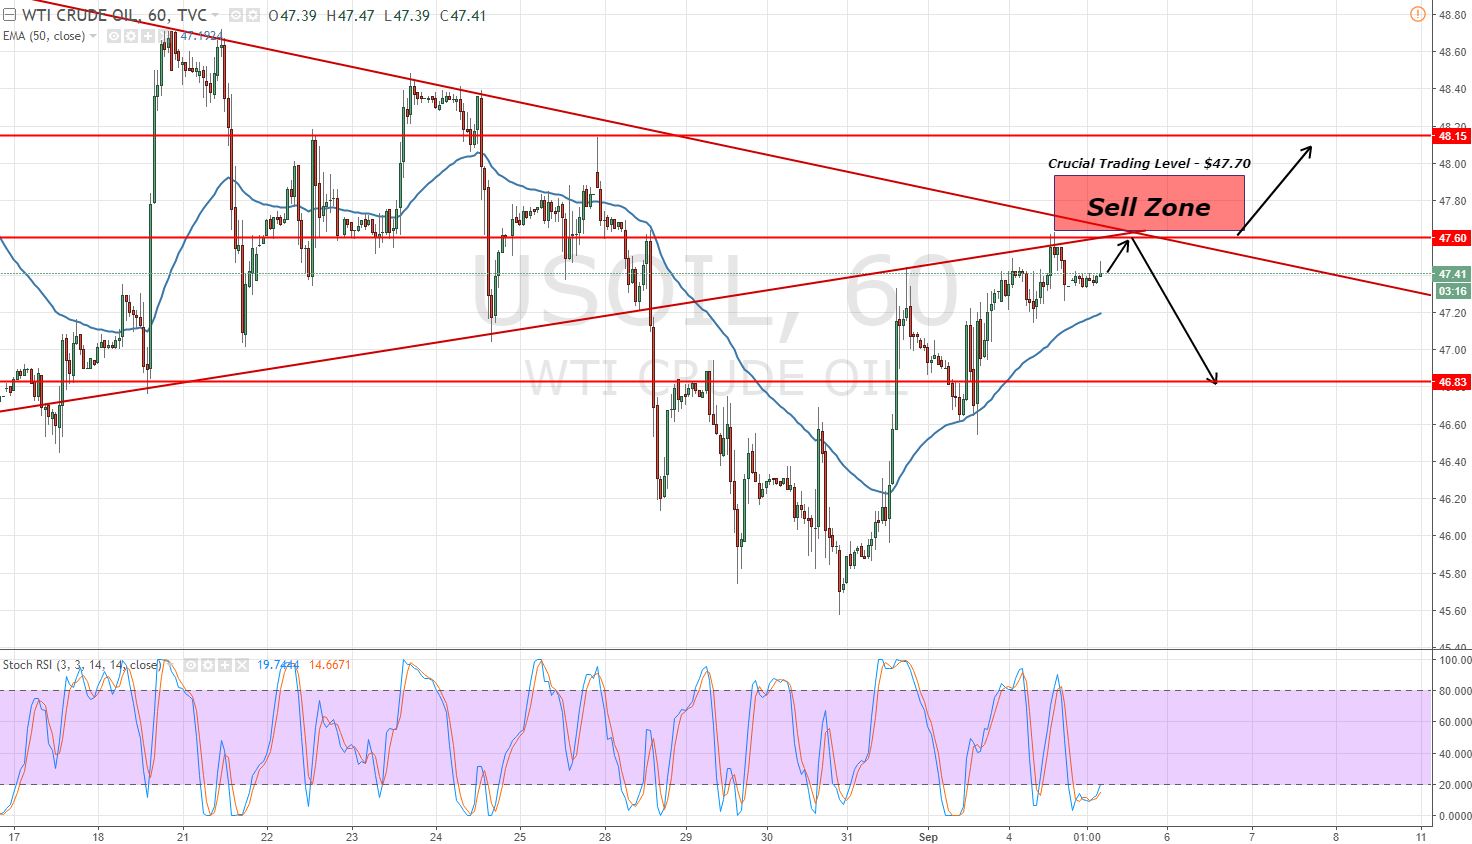 Crude Oil – Hourly Chart – Symmetric Triangle Pattern
Remember the Symmetric triangle pattern? It's now helping crude traders to determine the trend. The bullish trend line of the symmetric triangle pattern is extending a resistance at $47.70. Whereas, the bearish trend line is connecting at exactly the same level, $47.70
Crude Oil Trading Plan
Today, we need to monitor the key trading level of $47.70, below this, the market is likely to stay bearish until $47.20 & $46.85. Breakage above $47.70, can give us a buying opportunity until $48.15. Good luck!
- Check out our free forex signals
- Follow the top economic events on FX Leaders economic calendar
- Trade better, discover more Forex Trading Strategies
- Open a FREE Trading Account
- Read our latest reviews on: Avatrade, Exness, HFM and XM
Related Articles


Sidebar rates
Related Posts
