Get Ready to Trade EUR/JPY as this Tug of War is Coming to an End.
The EUR/JPY is stuck in a narrow trading range of 133 – 133.250 in the wake of a weaker euro (and yen). That’s right, both of these currencies lack demand. Investors are feeling hesitant to buy the euro before the ECB meeting. Whereas, the risk-on sentiment is driving yen sellers. But the tug of war between the bulls and bears is going to finish today with the release of the European monetary policy.
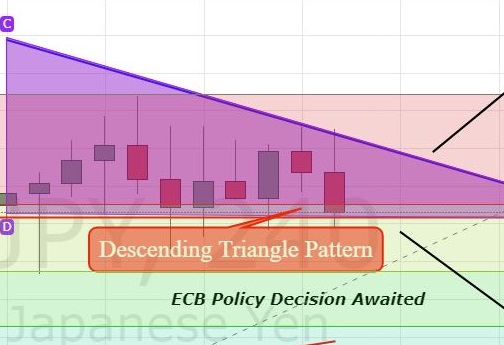
EUR/JPY – Descending Triangle Breakout
Looking at the 4-hour chart, the Japanese cross, the EUR/JPY, is facing strong resistance up at 133.250 along with support near 133 (double bottom pattern). Zooming out on the chart, it clearly looks like a small descending triangle pattern which is struggling to break downward. Is it going to break now or on the news? I can’t say much about it but it surely is a hot trading setup.
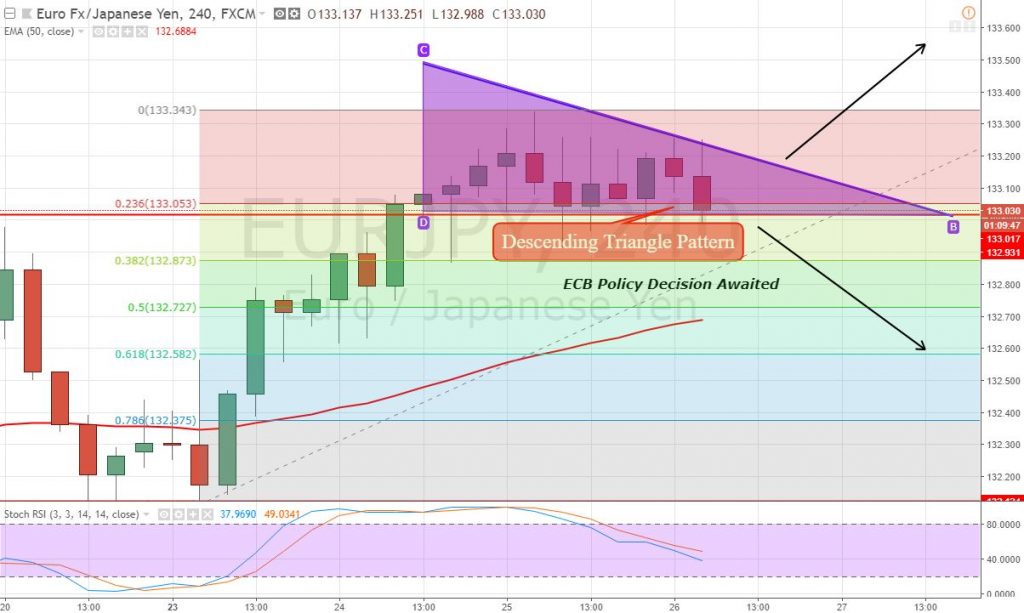
The RSI and stochastics have started coming out of the overbought territory, which is signaling the potential for a further retracement. By the way, Yuppy has already completed a 23.6% Fibonacci retracement at 133 and the 38.2% level prevails at 132.85. Check out the trade plan below…
EUR/JPY – Trading Plan
Although it’s preferred not to take a position until the release of the ECB’s monetary policy decision, the rough idea is to take a sell position bellow 132.95 to target 132.75 and 132.55. On the flip side, buying is preferred above 133.280 with a target of 133.650. Refer to April -26 Economic Event Brief for handy information on the ECB’s meeting & expectations. Good luck!


