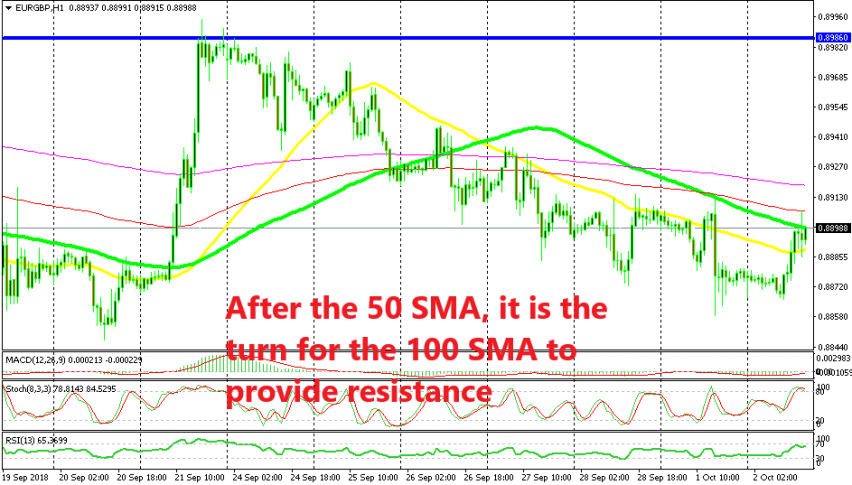
EUR/GBP turned bearish at the beginning of last week after the spike on September 21 as the European leaders rejected Theresa May’s Chequers plan. But after that spike, EUR/GBP entered a bearish phase and it has been following the bearish trend very strictly.
As you can see from the hourly chart above, this forex pair has found solid resistance at the 50 SMA (yellow) during pullbacks higher. So, there have been quite a few good trading opportunities since last Monday to sell EUR/GBP.
We have taken some of these opportunities and we decided to take another one today as EUR/GBP was retracing higher during the European session. The 50 SMA got broken to the upside yesterday but the 100 SMA (green) turned into resistance and the price reversed back down.

The 100 SMA is doing the resistance on the H4 chart
Today, EUR/GBP made another retrace higher but the 100 SMA was providing resistance once again, so we decided to sell right below it. If we switch to the H4 chart, we see that the 100 SMA was providing resistance yesterday and it is doing the same today.
The price climbed higher this morning but it started pulling back lower right after touching this moving average at 0.8907. The sellers haven’t taken control yet as a battle is going on between them and the buyers at the moment, but the area around the 100 SMA is offering strong resistance, so we might see this pair resume the bearish trend anytime now.


