AUD/USD Stuck Between 2 Moving Averages
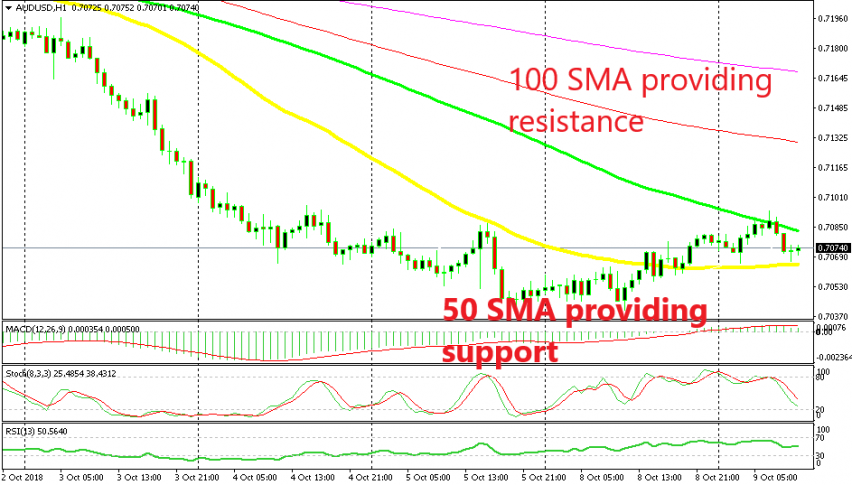
AUD/USD has been trading on a steep bearish trend during the last two weeks. Although, it retraced higher yesterday to the 50 SMA (yellow) on the hourly chart. So we decided to use that opportunity to open a sell signal at that moving average.
We did so and AUD/USD did find some strong resistance around the 50 SMA, but eventually the retrace stretched further up and the price broke above the 50 SMA. As we see this morning, the buyers pushed higher again during the Asian session amid some slight USD weakness.
But, the 100 SMA (green) turned into resistance this time. The price formed a couple of opposing hammers below that moving average and it reversed after that. Although, the 50 SMA has turned into support now.
In fact, the price has formed a bullish reversing setup on the H1 time frame. The stochastic indicator is almost oversold, the 50 SMA is providing support, and the price has formed a pin candlestick, which is a reversing signal. So, there is a chance that we might see AUD/USD turn higher as well and probably bounce up and down between the 50 SMA at the bottom and the 100 SMA at the top.
Although, the USD buyers are back in control as other major pairs are going in favour of the USD, so perhaps we will see the 50 SMA get broken to the downside soon. But, let’s leave the price to do all the talking now and let’s judge a few hours later after this pair has made its move.


