Bitcoin Respecting Technical Levels for a Change
Bitcoin has retraced higher from the lows last week, but it is finding hard to push too far above the $4,000 level.
BITCOIN has mainly traded on fundamentals but it is starting to respect the technical levels and indicators recently. The decline in cryptocurrencies finally came to a halt about two weeks ago after they entered the next bearish phase last month. Bitcoin lost nearly half its value during this time as it tumbled from over $6,000 to above $3,000 from the middle of November until mid-December.
It broke the major support levels at $5,000 and $4,000 without much trouble, but it finally found support above the $3,000 level in November and, after trading sideways for some time, it started climbing higher and moved above the $4,000 level again early last week.
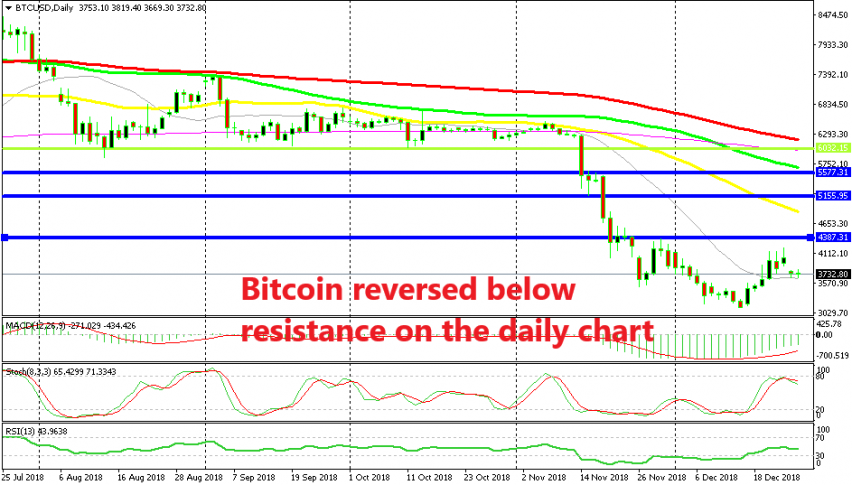
Although, the buyers looked cautious as they didn’t push too far above the $4,000 level. Bitcoin traded sideways for a few days as you can see from the daily chart above, but after the upside-down hammer candlestick which formed on Monday indicating a possible bearish reversal, the sellers finally came back again and it completed a big bearish candlestick on Tuesday.
The 50 SMA (yellow) which is approaching must have scared buyers as well. On the H4 chart, we have the 100 smooth MA (red) which was providing resistance for Bitcoin earlier this week and it id a good job, hence the bearish reverse in Bitcoin since then. Although, the 20 SMA (grey) is providing support right now on that chart as you can see.

So, we saw a bearish gap after Christmas. But, the low from back at the end of November and the high from early December around the $3,700 level has turned into support now and Bitcoin has bounced off of it twice in the last couple of days. But, the 50 SMA and the 100 simple MA (green) on the H4 chart has already caught up with the price.
In fact, they are coming from below, unlike in the daily chart where the 50 SMA is coming from above, so it has turned into resistance. The price reversed down from this moving average yesterday and it seems like it will be a big hurdle today as well to overcome. It stands just above the $4,000 level and even if that gets broken, the same moving average is reaching that level quickly on the daily chart so it will strengthen the resistance above.
Actually, I am thinking about going short on Bitcoin above the $4,000 level which was the high last week, with a stop above the 50 SMA on the daily chart and leave the take profit target open.
- Check out our free forex signals
- Follow the top economic events on FX Leaders economic calendar
- Trade better, discover more Forex Trading Strategies
- Open a FREE Trading Account
- Read our latest reviews on: Avatrade, Exness, HFM and XM
Related Articles


Sidebar rates
Related Posts
