Bitcoin Tries to Turn Bearish From the $4,000 Resistance Zone but the 200 SMA Is Still Holding, or Is It?
Bitcoin has found solid support at the 200 SMA for a week, but this moving average is in danger now
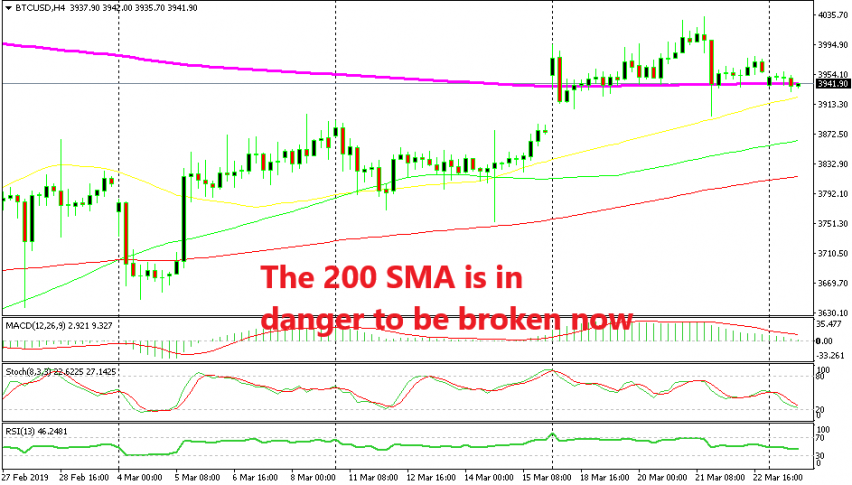
BITCOIN had a good month in February which was the first one in a long time, as cryptocurrencies have been on a bearish trend for more than a year now. Although, this month the price action has been mostly sideways, but last week, Bitcoin broke above the 200 SMA (purple) on the H4 chart, which has been providing resistance.
The buyers tried to push further higher last week and we saw the price break above the $4,000 level which has been resistance since December last year. But, this is a major resistance level and such levels come with a buffer zone around them, so the resistance zone for Bitcoin stretched all the way to $4,200.
Bitcoin only reached as high as $4,033 on my platform which means that the resistance zone wasn’t broken. Bitcoin made a quick reversal lower on Wednesday last week losing nearly $150 in a couple of hours and pierced the 200 SMA. But, this moving average hed its ground and that H4 candlestick closed above the 200 SMA.
So, the 200 SMA wasn’t broken and it remained unbroken for the whole week. That means that this moving average has now turned into strong support. But, the price has been flirting with it for quite some time and now it is slipping below it. If a break occurs and the price continues further down below the 200 SMA, then the break will be official and I think the sellers will try to resume the bigger bearish trend since the buyers would be discouraged. So, let’s keep an eye on the price action in the coming days and see if the break will come.
- Check out our free forex signals
- Follow the top economic events on FX Leaders economic calendar
- Trade better, discover more Forex Trading Strategies
- Open a FREE Trading Account
- Read our latest reviews on: Avatrade, Exness, HFM and XM
Related Articles


Sidebar rates
Related Posts
