Gold Retreats as Sentiment Improves, But MAs Continue to Keep it Bullish
The global economy has been on a slippery slope for about a year and the trade war has escalated since last year. In such cases when traders are unsure of what to buy, they usually divert their attention towards safe havens, which means that the CHF, JPY and GOLD have been in demand.
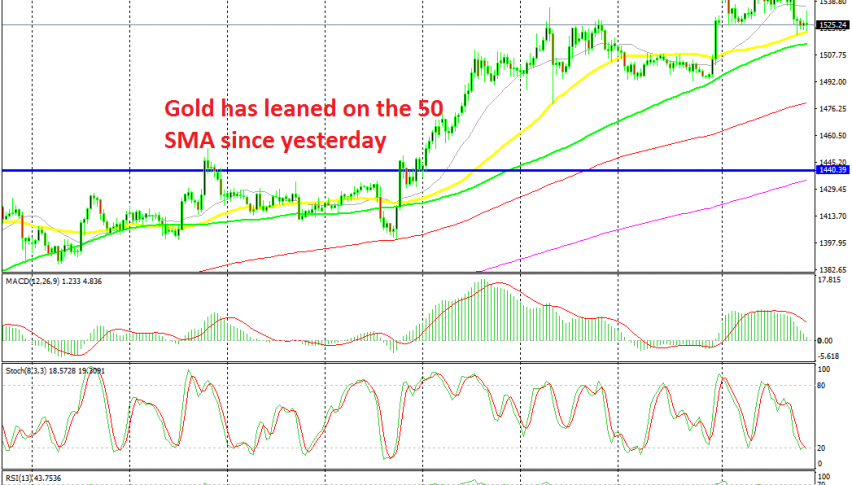
That can be observed by the H4 chart in Gold which shows that the pressure is totally to the upside. Things have deteriorated in the last couple of months and the bullish trend has gotten stronger for Gold, climbing nearly $200 during this time.
We saw the latest surge at the end of last week when Donald Trump announced a 5% increase in tariffs on China and a bullish gap over the weekend. But, China and the US have softened their tones this week, which has helped improve the sentiment in financial markets, so safe havens have retreated lower. But the main trend is still quite bullish for Gold.
Moving averages have been the main indicators which have kept Gold bullish, providing support during pullbacks lower and pushing the price higher again. This time it’s the 50 SMA (yellow) on the H4 time-frame that is providing support. Gold is now oversold on this chart as stochastic shows, so this might as well be a great opportunity to go long on Gold.
Although, Chinese officials made some positive comments again this morning on trade, which is keeping the pressure down at the moment, so I will wait for this momentum to fade and buy against the 50 SMA or the 100 SMA (green) lower.


