EUR/USD Forms a Bearish Reversing Pattern on the Daily Chart and Falls Just Before ECB Meeting
EUR/USD found solid resistance at the 20 SMA for several days before turning bearish yesterday, ahead of the ECB
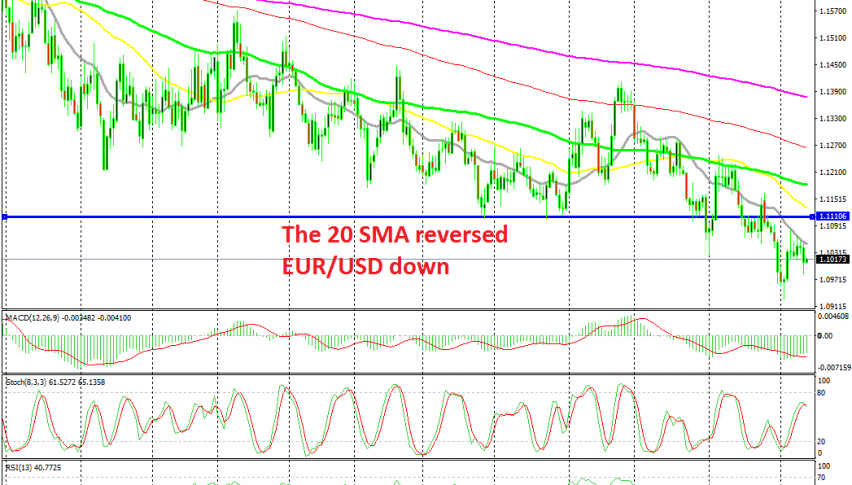
[[EUR/USD]] turned bullish last week, surging from 1.0920s to 1.1080s in a few days. But, the buyers couldn’t take out the 20 SMA (grey) on the daily time-frame chart. The bearish trend strengthened the week before, breaking the big round level at 1.10 and in such times, the smaller period MAs come into play.
The 20 SMA has turned into resistance for this pair, which shows that the selling pressure is pretty strong on this chart. Also, the range trading of the last several days shows that the pressure is on the downside, since the other major currencies kept gaining against the USD, while the Euro traded sideways.
The price formed quite a few doji and pin candlesticks which are a reversing signal, especially when this pair was finding solid resistance at the 100 SMA. Then yesterday the reversal came, as we head into the September ECB meeting. Odds are high that the ECB announces a date for the beginning of a monetary stimulus package, such as a QE programme or further rate cuts, or both.
But, if they fail to set a date today the markets will most probably get disappointed and we might even see a surge in Euro pairs. So, this may go both ways. Although, the market has priced in a set date for today, hence the bearish return yesterday. But, you never know. We will be here to cover that meeting live on our economic calendar by the way.
- Check out our free forex signals
- Follow the top economic events on FX Leaders economic calendar
- Trade better, discover more Forex Trading Strategies
- Open a FREE Trading Account
- Read our latest reviews on: Avatrade, Exness, HFM and XM
Related Articles


Sidebar rates
Related Posts
