MAs Keep Pushing Ethereum Lower
Ethereum has been pretty bearish during Q3, after surging in Q2 and MAs are keeping it bearish
ETHEREUM turned pretty bullish in Q2 of this year, after consolidating in Q1, which followed a terrible year in 2018. The price surged from around $75 in Q1, to $370 by the end of June. But, the rush for cryptocurrencies ended and Ethereum reversed back down.
Ethereum has turned bearish and has lost $200 from the top, so the picture here looks more bearish than in BITCOIN , which only lost around 50% of its value from the top at the same time. Ethereum has lost more than half the value, on the other hand.
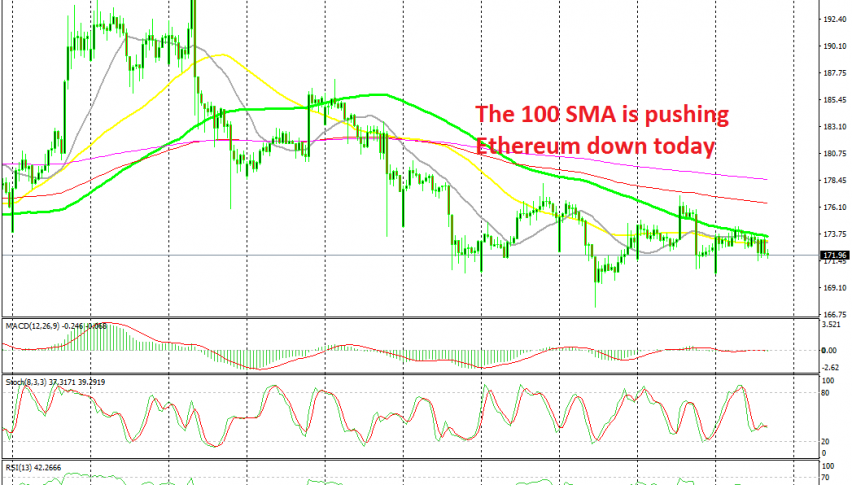
Ethereum continues to slide down and moving averages are doing a good job in providing resistance and pushing the price lower on the H1 chart. The 20 SMA (grey) and the 50 SMA (yellow) have been providing resistance, while in the last two days the 100 SMA (green) has caught up with the price and taken over that job.
Today, Ethereum retraced higher, but the limb ended at the 100 SMA and reversed back down. this shows that the pressure is still on the downside for this altcoin. So, for now we have a bearish bias for Ethereum until the price moves above all moving averages.
- Check out our free forex signals
- Follow the top economic events on FX Leaders economic calendar
- Trade better, discover more Forex Trading Strategies
- Open a FREE Trading Account
- Read our latest reviews on: Avatrade, Exness, HFM and XM
Related Articles


Sidebar rates
Related Posts
