Can NZD/USD Break Above the 200 SMA on the Daily Chart?
NZD/USD has been bullish for two months, but it is facing the 200 SMA on the daily chart now
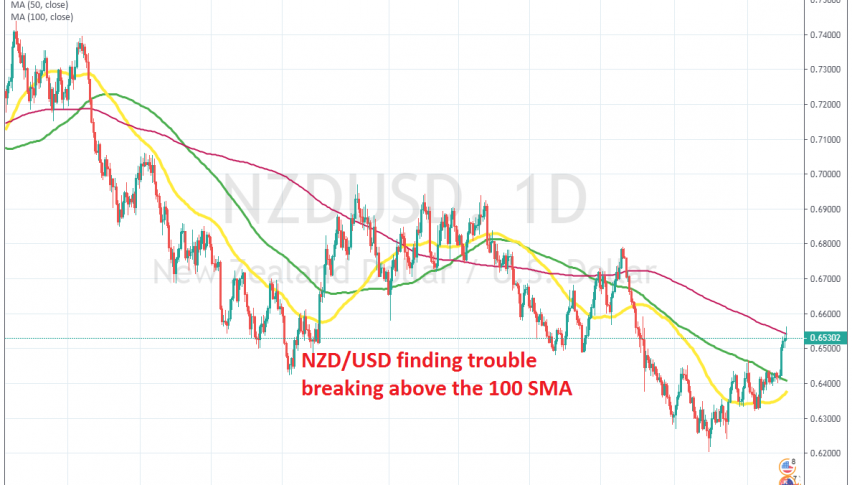
[[NZD/USD]] has been trading on a bearish trend since March last year, when the USD made the big turnaround. Since then, this pair has lost more than 12 cents from top to bottom. During this time, moving averages have been providing resistance, pushing the price down, although, they have also turned into support at times when the price has moved above them.
The 50 SMA (yellow) in particular was doing a good job last year in providing resistance. Although, we are seeing another decent retrace higher now, which started two months ago. The sentiment improved in October after US and China were progressing towards Phase One deal.
The 50 SMA turned into support as the price moved above it on the daily chart, while the 100 SMA (green) turned into resistance in November. But, that moving average was broken after the soft US ISM manufacturing report on Monday and this pair continued to climb higher.
Although, now NZD/USD is facing the 200 SMA (red), where it pulled back lower yesterday. This moving average has provided support and resistance before for NZD/USD, so buyers will have some trouble pushing above it, I suppose. If they do, then that will be another strong signal that the situation might have changed for this pair.
- Check out our free forex signals
- Follow the top economic events on FX Leaders economic calendar
- Trade better, discover more Forex Trading Strategies
- Open a FREE Trading Account
- Read our latest reviews on: Avatrade, Exness, HFM and XM
Related Articles


Sidebar rates
Related Posts
