The 50 SMA Comes Into Play in NZD/USD After the 20 SMA is Broken
NZD/USD has been bullish for a long time, but today we are seeing a pullback lower at the 50 SMA on the H4 chart
Last week we decided to buy NZD/USD after a small pullback lower on the H1 chart. The trend had been bullish for more than 2 months and in the first week of this month we saw another strong bullish move, which came after the US ISM manufacturing report showed that this sector fell deeper in contraction.
Then, last week the sentiment improved further after the UK elections and the Phase One deal between US and China was accepted by both parties. As a result, safe havens turned bearish, while safe havens climbed higher, as shown by the upside momentum in NZD/USD.
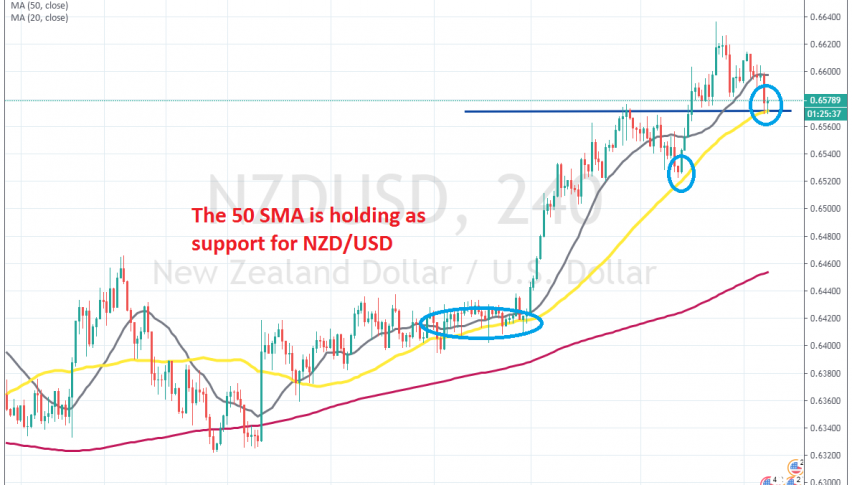
So, we decided to go with the flow and now we are long on this pair. Yesterday, we were around 20 pips in profit after this pair bounced off the 20 SMA (grey), which has turned into support when the trend has been strong. But, the trend has slowed today and the larger moving averages have come into play.
The 20 SMA was broken but it seems like the 50 SMA (yellow) has come to the rescue, as it is providing support on the H4 chart. The price has formed a small hammer which is a bullish reversing signal after the pullback, although there’s still some time to go until this candlestick closes. This level was the high at some point last week, so it might turn into support now, helped by the 50 SMA as well. We surely hope so, since we are long on this pair.
- Check out our free forex signals
- Follow the top economic events on FX Leaders economic calendar
- Trade better, discover more Forex Trading Strategies
- Open a FREE Trading Account
- Read our latest reviews on: Avatrade, Exness, HFM and XM
Related Articles


Sidebar rates
Related Posts
