EUR/USD Overcomes the 50 SMA on the Weekly Chart
EUR/USD has been bearish for a really long time, with MAs pushing it lower, but it has climbed above the 50 and 100 SMAs now
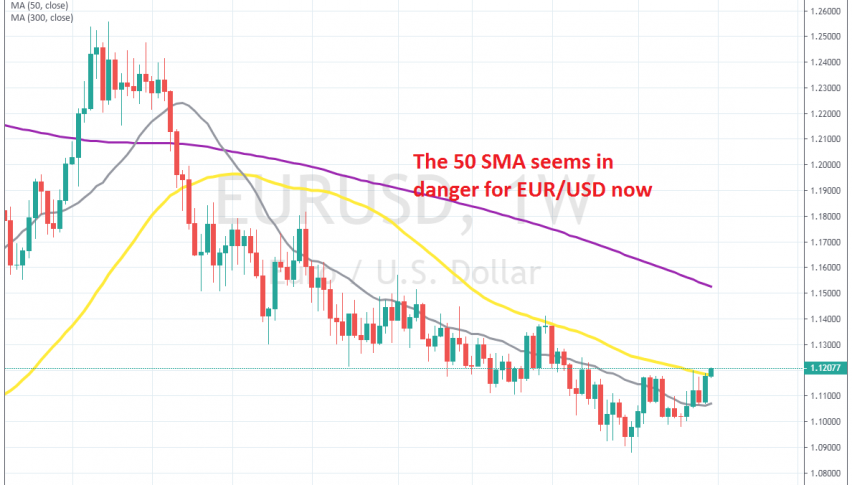
[[EUR/USD]] has been trading on a bearish trend since spring last year. The first phase of the decline was pretty ferocious after the bearish reversal, with EUR/USD losing around 12 cents from top to bottom, until August 2018. The pace of the decline has slowed down since then, but sellers have been in control nonetheless.
Moving averages have done a good job in providing resistance when this pair has retraced higher. The 20 SMA (grey) in particular has been ending the retraces higher and has pushed the price lower on the weekly time-frame. The 50 SMA has also come to the rescue when the 20 SMA has given up.
EUR/USD made some new lows in September, after the European Central Bank cut deposit rates further to -0.50% and announced a new QE programme, which started in November. But, the sentiment has improved in financial markets in recent months and we have see another pullback higher.
But, this looks a bit different from other pullbacks. The price has moved above the 50 SMA and is moving above the 100 SMA now. If the 100 SMA gets broken, then sellers will likely get scared and close more of their short positions, which will add further fuel to the upside. We might see 1.15 in that scenario, where the 200 SMA (purple) stands, which would be a good place to open a long term sell signal. But, one thing at a time; let’s first see if the 50 SMA will be broken properly this week.
- Check out our free forex signals
- Follow the top economic events on FX Leaders economic calendar
- Trade better, discover more Forex Trading Strategies
- Open a FREE Trading Account
- Read our latest reviews on: Avatrade, Exness, HFM and XM
Related Articles


Sidebar rates
Related Posts
