AUD/USD Returns Below the 50 Weekly SMA, as Odds of RBA Cutting Rates Stand at 50/50
AUD/USD has been on a bearish trend for nearly two years, but it retraced higher in October, on prospects of a partial trade deal between US and China. That trade deal was agreed upon in December and this pair increased the pace of pushing higher, as the USD turned bearish, also due to year-end cash flows.
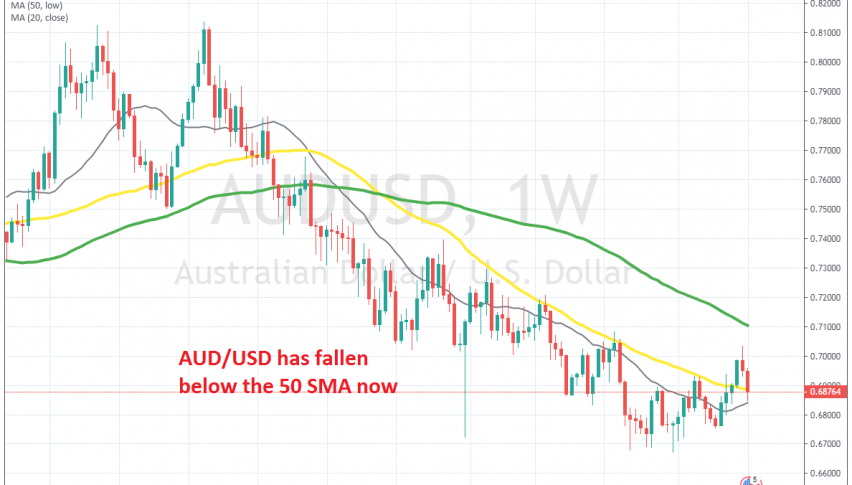
In the last week of last year, AUD/USD pushed above the 50 SMA (yellow) on the weekly chart. This moving average has been providing resistance for the pair since October 2018. So, the move above it raised some eyebrows, thinking that a deeper pullback might occur or even a reversal.
But, the year-end cash flows ended at the end of December and the unwinding began immediately in the new year. The sentiment then turned quite negative, as geopolitical tensions increased between US and Iran, which pushed risk assets further down. The sentiment improved in the last two days, but the USD has continued to push higher, so AUD/USD has continued to slip lower.
It broke below the 50 SMA again this week, so the downtrend continues for this pair. The odds of the Reserve Bank of Australia cutting interest rates again in the next meeting are now 50/50, which is another reason for the decline. So, we will try to get short on AUD/USD when it retraces higher, probably on the H4 chart.


