Will the 20 SMA Turn From Support Into Resistance for NZD/USD?
NZD/USD has been really bullish this year, especially after the lock-down months. During September and October we saw a slight pullback lower, but the bullish trend resumed again after the US elections and November was quite bullish for this pair.
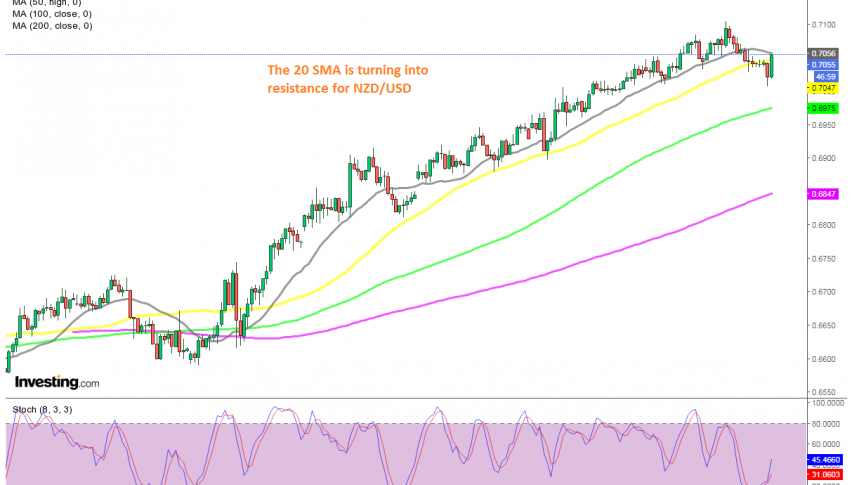
NZD/USD surged again more than 5 cents higher, from around 0.66 to above 0.71 last Thursday. During the uptrend of the last month, moving averages have been doing a great job as support on the H4 chart. When the trend was stronger, the 20 SMA (grey) provided support, when the pullbacks were a bit deeper, the 50 SMA (yellow) took up that job.
Although in the last two days of last week, we saw a deeper retrace down, which was due after this pair kept a straight bullish tend for more than a month. The pullback down continued today and NZD/USD lost around 100 pips, but the decline stopped just above the big round level at 0.70.
We opened a buy forex signal last Friday, hoping for a reversal, but the reversal only came today. The price has bounced around 50 pips higher in this pair and is trading right at the 50 SMA now, at 0.7050. The 50 SMA was providing support for this pair earlier today, but buyers managed to push above it and now the 20 SMA is the next obstacle for them to overcome. Our signal here is in profit at the moment, but let’s hope buyers will push above he 20 SMA and reach our take profit target.


