⚡Crypto Alert : Altcoins are up 28% in just last month! Unlock gains and start trading now - Click Here

US Employment Jump Above 800K Again
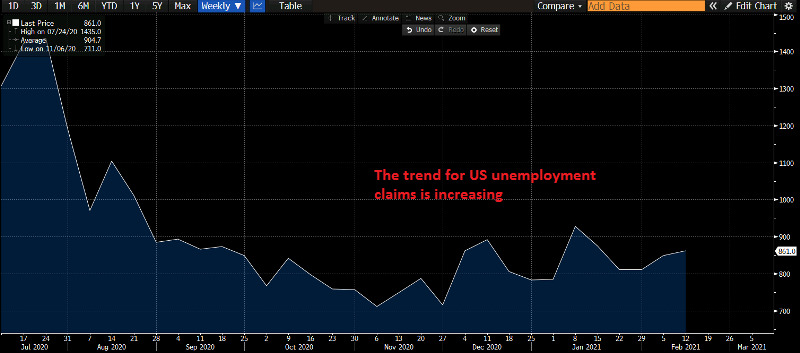
Employment has been difficult to come back to normal levels in the US. It started improving after the big surge in unemployment claims in Spring last year. But, claims have stopped declining and have been stuck above 800K for some time now and the cold weather is not helping either.
US weekly initial jobless claims and continuing claims
- Initial jobless claims 861K vs 773K estimate.
- Prior week was 793K , revised to 848K
- 4 week moving average of initial claims 833.25K vs 836.75K last week (revised)
- Continuing claims 4494K vs. 4425K estimate. Prior week revised to 4558K vs 4545K initially reported
- 4 week moving average of continuing claims 4632K vs last week 4752.25K
- The largest increases in initial claims for the week ending February 6 were in Ohio (+92,667), California (+28,688), Georgia (+5,171), Mississippi (+3,796), and Colorado (+3,045),
- The largest decreases were in Florida (-47,430), New York (-17,407), Maryland (-16,585), Kansas (-12,376), and Arizona (-7,478).
- During the week ending January 30, 51 states reported 7,685,389 continued weekly claims for Pandemic Unemployment Assistance benefits and 51 states reported 4,061,305 continued claims for Pandemic Emergency Unemployment Compensation benefits
The employment data is going the wrong way. This weeks data corresponds with the survey week for the BLS employment report released in the 1st week of March.
Philadelphia Fed Manufacturing Index February 2021
- January was 26.5 points, the highest since February 2020
- New orders 23.4 vs. 30.0 last month, down 6.6 points
- Shipments 21.5 vs. 22.7 last month, down -1.2 point
- Employment 25.3 vs. 22.5 last month, up 2.8 points. 8th consecutive increase
- Average workweek index 30.6 vs. 18.6 last month. 8th consecutive gain
- Prices paid 54.4 vs. 45.4 last month
- Prices received 16.7 vs. 36.6 last month
- Inventories 20.0 vs. 12.6 last month
- Delivery times 15.1 vs. 30.0 last month
- Unfilled orders 12.6 vs. 25.6 last month
- Full report
Overall the index is lower for the month after last month spike higher to the highest level since February 2020. Nevertheless, it came in better than expectations and remains toward the upper end of the 2019 indexes.
Check out our free forex signals
Follow the top economic events on FX Leaders economic calendar
Trade better, discover more Forex Trading Strategies
Related Articles
Comments
Subscribe
Login
0 Comments


