ETH/USD Violates Symmetrical Triangle Pattern – Brace for Sell!
The ETH/USD was closed at $1886.25 after placing a high of $2245.58 and a low of $1886.25. ETH/USD dropped on Monday
Written by:
Arslan Butt
•
Tuesday, June 22, 2021
•
2 min read
•
Last updated: Tuesday, June 22, 2021
The
ETH/USD closed at $1,886.25, after reaching a high of $2,245.58, and a low of $1,886.25. On Monday, the
ETH/USD dropped to its lowest level since March 31, following the latest cryptocurrency crackdown in China.
On Monday, China announced that it had summoned officials from its biggest banks to a meeting, in order to reiterate a ban on providing cryptocurrency services. The meeting was attended by the representatives from the Industrial, Commercial and Agricultural Banks of China, along with the payment service provider Alipay. They were reminded of rules that prohibit Chinese banks from engaging in crypto-related transactions.
The country has planned to root out all
Bitcoin and Ether mining operations within a year, which has weighed on Bitcoin and Ethereum. The Agricultural Bank of China also announced, after this ban, that it would halt all of its services related to cryptocurrency. Furthermore, the bank said that if it finds out that any customer is engaging in any business related to cryptocurrency, it will terminate his account. This news added further pressure to the declining prices of Bitcoin, ultimately weighing on the cryptocurrency market. The ETH/USD also followed the trend, falling to its lowest level in more than two and half months on Monday.Additionally, institutional managers continued to profit from their cryptocurrency holdings, which raised the outflows from digital asset investment products to a total of $79 million last week. It was the third consecutive weekly decline and the longest stretch of drawdowns since February 2018. The outflows from bitcoin totaled $89 million and Ethereum saw a drop of $1.9 million. This also put pressure on the crypto market and dragged the ETH/USD to the downside.
However, the losses in the ETH/USD were capped by the declining prices of the US dollar on Monday. The greenback saw a pause in its rally, driven by the hawkish Fed on the first day of the week, as profit-taking and correction gained pace. The US Dollar Index reached 91.83, capping any further downside momentum in the ETH/USD.

Daily Technical Levels
Support Resistance
2,142.44 2,293.90
2,041.47 2,344.39
1,990.98 2,445.36
Pivot Point: 2,192.93The
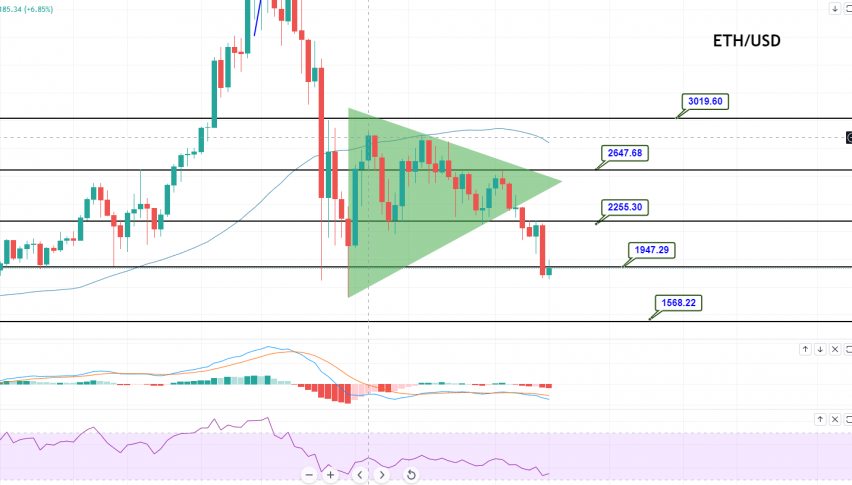
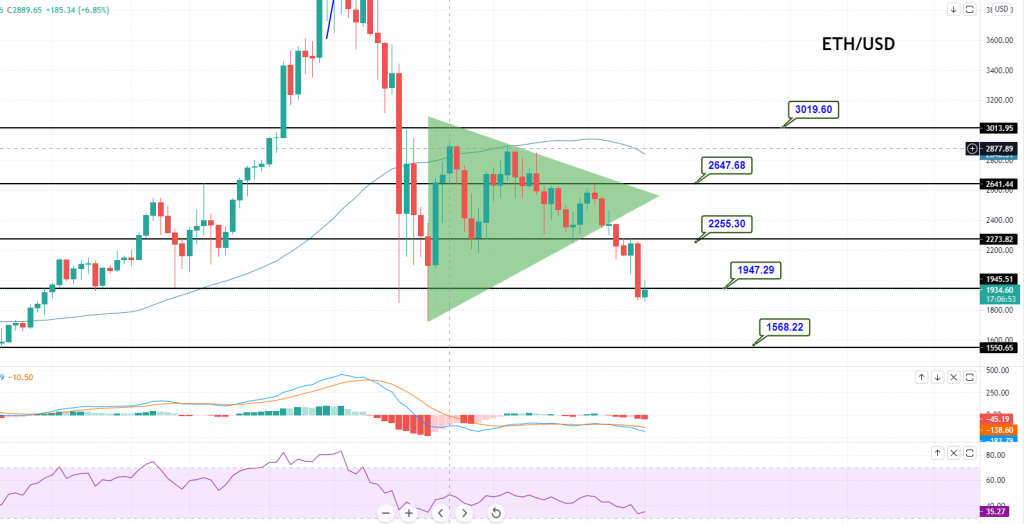
ETH/USD pair has violated the support area of $2,255 on the daily timeframe, and now it’s heading further down, towards the next support level. The double bottom pattern is supporting the pair at around 1,947. A bearish breakout at this support level could trigger sharp selling until the 1,568 level. Let’s consider taking a selling trade below the 2,150 level today. Good luck!
Arslan Butt
Lead Markets Analyst – Multi-Asset (FX, Commodities, Crypto)
Arslan Butt serves as the Lead Commodities and Indices Analyst, bringing a wealth of expertise to the field. With an MBA in Behavioral Finance and active progress towards a Ph.D., Arslan possesses a deep understanding of market dynamics.
His professional journey includes a significant role as a senior analyst at a leading brokerage firm, complementing his extensive experience as a market analyst and day trader. Adept in educating others, Arslan has a commendable track record as an instructor and public speaker.
His incisive analyses, particularly within the realms of cryptocurrency and forex markets, are showcased across esteemed financial publications such as ForexCrunch, InsideBitcoins, and EconomyWatch, solidifying his reputation in the financial community.