MAs Pushing Cardano Down on H4 Chart, While the 200 Daily SMA Waits to Provide Support
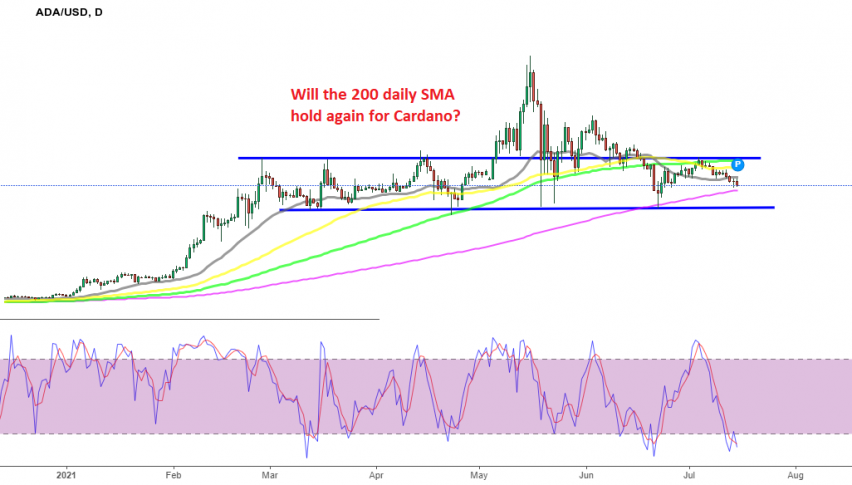
Cardano has turned bearish since May, following the rest of the market on its downward journey, as China escalates the war on cryptocurrencies, particularly on Bitcoin mining. Cardano pierced the 50 SMA (yellow) and the 100 SMA (green) on the daily chart, but couldn’t close below them.
These moving averages turned into support, holding for about a month until the middle of June, when the second wave of panic sent the crypto market down again, with most of the cryptocurrencies making new lows. The highs were getting lower in Cardano, so the break wasn’t much of a surprise, but the 200 SMA (purple) held as support on the daily chart, and after a doji candlestick the ADA/USD bounced higher.
The price returned back down and now it seems to be heading for the 200 SMA again, which is quite close. Yesterday we saw a doji candlestick, which is a bullish reversing signal after the retreat, but we are not seeing a bullish candlestick today. The 20 SMA (gray) rejected the price yesterday, so sellers remain in charge right now.

On the H4 chart, the situation seems more pessimistic, since there are no more indicators such as moving averages to provide support. Instead, they are providing resistance at the top, pushing the price down on this time-frame. But, the ultimate support zone surrounding the $1 level still stands, although we are some distance above it. So, it will take some time to get down there, where we would consider going long. Until then, we will watch the price action to wait for any changes.


