Ascending Triangle Pattern Supports Ripple – Brace for a Buy Limit
The XRP/USD coin has managed to extend its early-day gaining streak to the 0.8156 level. It drew further bids well above 0.81204 support lev
Written by:
Arslan Butt
•
Tuesday, August 10, 2021
•
2 min read
•
Last updated: Tuesday, August 10, 2021
The XRP/USD coin has managed to extend its early-day gaining streak, rising to the 0.8156 level. It drew further bids well above the 0.81204 support level, even after the price of Ripple experienced a huge downfall. The bearish correction came as a result of the continuing lawsuit urged by the SEC. This lawsuit has thus far prevented the company from going public.
The XRP has had a dysfunctional year, due to its ongoing case with the SEC, which has dragged on, to the detriment of both parties. The price of XRP was expected to rise above the $2 mark this year, but unfortunately, the company has not been able to go public yet.
Despite these negative actions, the mood in the Ripple company remains cool. It starts new projects and makes acquisitions to cement its place as the leading blockchain payment provider. XRP keeps pushing its services in Asia, having recently deployed its On-Demand Liquidity through RippleNet, allowing corporations to convert fiat into XRP and vice-versa.On the USD front, the broad-based US dollar managed to extend its upward rally of the previous session, drawing some fresh bids near multi-month highs on the day, as investors are positioning themselves for the US Federal Reserve to start asset tapering earlier than scheduled, thanks to the latest, better-than-expected US jobs report.
The upticks in the greenback kept the XRP/USD prices under pressure. The latest US jobs report, released on Friday, showed that non-farm payrolls grew by a better-than-expected 943,000. At the same time, the unemployment rate dropped to 5.4% in July.

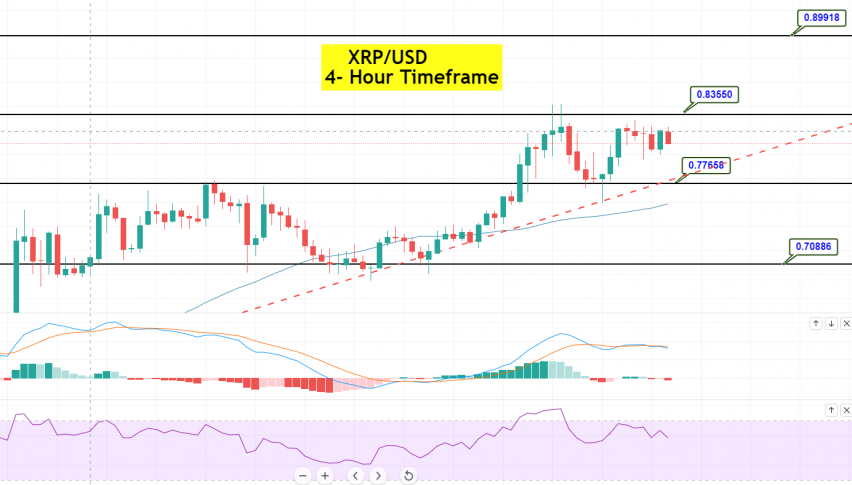
Ripple (XRP/USD) Technical Outlook – Double Top Pattern at $0.8355
The XRP/USD coin is trading with a bullish bias at 0.8125, facing immediate resistance at 0.8355. On the higher side, a breakout at 0.8355 could lead the XRP/USD price towards the next resistance level of 0.8991 level. At the same time, the support remains at 0.7765.
On the 4-hour timeframe, the XRP/USD pair has formed an ascending triangle pattern that is likely to trigger a bullish breakout. If this happens, the buying trade will be worth capturing. The MACD and the RSI are tossing about between the buying and selling zones. However, the 50 periods simple moving average is there to provide support at 0.7585. Let’s look for a buying trade over the 0.7765 level today. Good luck!
12h
Arslan Butt
Lead Markets Analyst – Multi-Asset (FX, Commodities, Crypto)
Arslan Butt serves as the Lead Commodities and Indices Analyst, bringing a wealth of expertise to the field. With an MBA in Behavioral Finance and active progress towards a Ph.D., Arslan possesses a deep understanding of market dynamics.
His professional journey includes a significant role as a senior analyst at a leading brokerage firm, complementing his extensive experience as a market analyst and day trader. Adept in educating others, Arslan has a commendable track record as an instructor and public speaker.
His incisive analyses, particularly within the realms of cryptocurrency and forex markets, are showcased across esteemed financial publications such as ForexCrunch, InsideBitcoins, and EconomyWatch, solidifying his reputation in the financial community.