Gold Showing Resilience And Willing for Further Gains, After Rebounding Off the Support
Last week's decline spilled over to this week, but Gold closed it higher eventually after the reversal
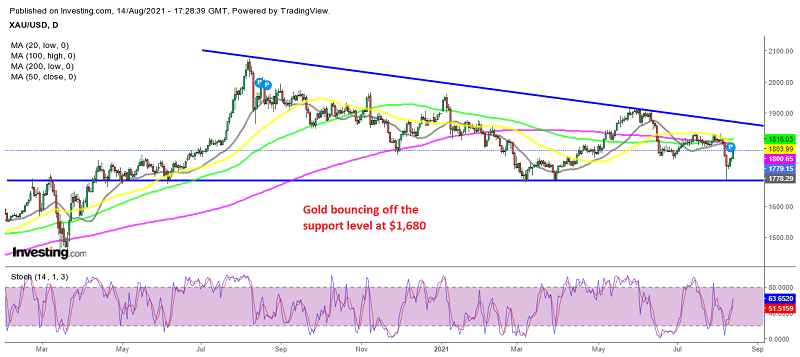
Gold made a bearish reversal at the end of last week, after failing to push above the 50 SMA (yellow) on the daily chart. That moving average had provided resistance for nearly a month and the decline started after the upside-down pin candlestick below that moving average, which is a bearish reversing signal.
In about three days, Gold fell $150 as it crashed from above $1,830 to $1,680. That big crash turned the picture quite bearish for Gold, after the first bearish leg in the middle of June. But, the decline stopped suddenly at $1,680, where it had stopped before. Gold retreated higher, claiming back more than half the losses that day, which was the first sign that the selloff might be over.
On the following day, XAU/USD formed a small doji candlestick, which is a bullish reversing signal after the decline. The price started reversing in the coming days and ended the week $100 higher from the lows, which is another bullish signal.

Gold closed above the 100 weekly SMA eventually
On the weekly chart, the picture is clearer. was failing to move above the 50 SMA (yellow) for several weeks and eventually, it reversed back down. The 100 SMA (green) was providing support on this time-frame chart, pushing the lows higher since March, but sellers pushed the price below it this week. Last week’s candlestick closed right at that moving average, while early this week sellers pushed below it.
Although, it still remains unbroken officially, since this week’s candlestick closed well above it, which is a bullish sign on this chart. The stochastic indicator is also oversold on this time frame, so it should be reversing up soon. This sort of chart setup points to further gains, at least until the top line of the triangle that’s forming. That comes at around $1,850-60 and the fundamentals sort of support that as well. The uncertainty is increasing with the increasing restrictions due to the delta coronavirus variant and the University of Michigan consumer sentiment indicator showed that. So, we will likely see Gold continue to climb in the following days/weeks.
Gold Live Chart
- Check out our free forex signals
- Follow the top economic events on FX Leaders economic calendar
- Trade better, discover more Forex Trading Strategies
- Open a FREE Trading Account
- Read our latest reviews on: Avatrade, Exness, HFM and XM
Related Articles

Sidebar rates
Related Posts
