On the contrary, the concerns over hurricane Ida, typhoon Chanthu, and tropical storm Nicholas seem to be keeping the yellow-metal buyers hopeful, amid the the bearish moves in the greenback and the downbeat performance of the US Treasury Yields. It should be noted that the lower US Treasury Yields initially aided
gold prices in posting their most significant daily gains since August 2003.However, the cautious mood ahead of the crucial US Consumer Price Index (CPI) data for August is keeping gold in a familiar region. Similarly, China’s recent aggressive behavior against global leaders, and hopes on the vaccine front in the Asia-Pacific region, are helping to limit further losses in the gold prices. The yellow metal is currently trading at 1,790.63, and consolidating between 1,789.80 and 1,793.72.
Receding Geopolitical Fears, Easing Virus Fears & Vaccine-related Hopes
Despite the anxiety among market traders, ahead of the crucial US Consumer Price Index (CPI) data, the market trading sentiment maintained its positive overnight moves early on Tuesday, remaining well bid ahead of the European session, as the global push for faster administering of vaccinations helped the market stay bid.
In the meantime, Iran’s willingness to surrender investigation rights at the nuclear facility has had some additional positive impact on the market trading sentiment. The US 10-year Treasury Yields rose by 1.7 basis points (bps), to recover 1.34%, reversing the previous day’s losses.
Similarly, the S&P 500 Futures were green, and up by 0.17% intraday, at around 4,76 by press time. The upbeat tone in global equity markets at the time weakened the safe-haven gold prices.
Weakness in US Dollar Supporting Gold
On the USD front, the broad-based US dollar failed to recover its losses of the previous day, remaining subdued as investors refocused on the coming US inflation data, which is due later in the day.
Analysts expect these readouts to show that the headline consumer price index (CPI) dipped slightly to 5.3% in August. They also see the core CPI coming in at around 4.2%, above the Fed’s target of 2.0%. Thus, the cautious sentiment ahead of the critical US data kept the American currency under pressure.
In addition to this, the upbeat market mood also put some downside pressure on the safe-haven US dollar. The declines in the greenback are helping to limit deeper losses in the precious metal, as the price of gold is inversely related to the price of the US dollar.
Coronavirus (COVID-19) & Downbeat Economic Data:
In contrast, the COVID fears remain on the cards, joining the tapering chatter, which is challenging the optimists ahead of the key US inflation figures, that will help forecast the Fed’s moves next week. This may cap more profound losses in the gold prices.
Besides this, hurricane Ida, typhoon Chanthu and tropical storm Nicholas seem to be keeping gold buyers hopeful, by leaving some negative impact on the market trading sentiment, which may boost the price of the safe-haven precious metal. Moving forward, market traders will need to keep their eyes on the US Consumer Price Index (CPI) for August for a fresh impulse.

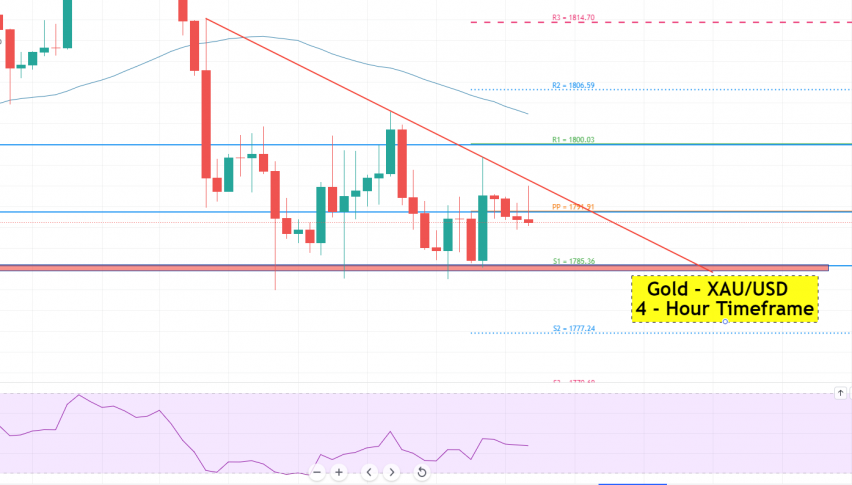
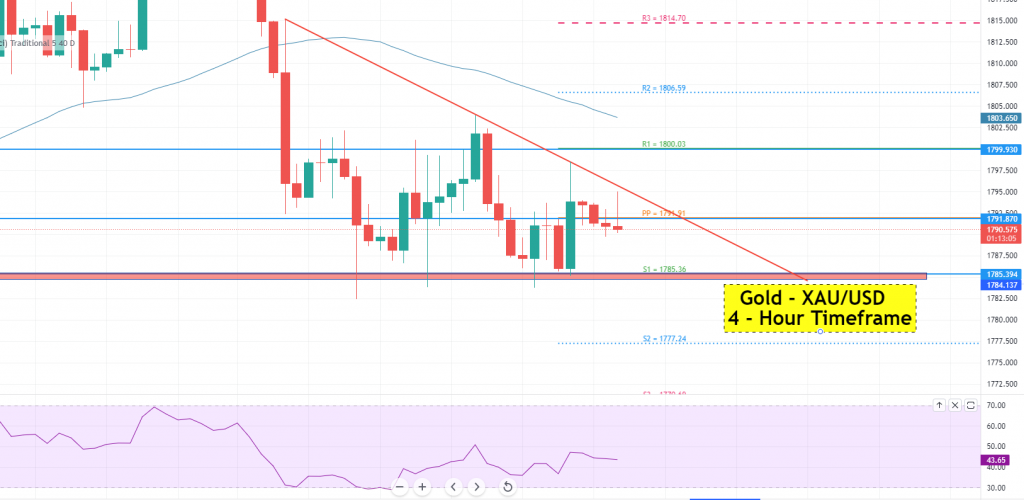
Gold (XAU/USD) – Technical Outlook – Pivot Point Resistance at $1,793
Gold is currently trading with a positive bias, as it remains beyond a pivot point trading mark of 1,793. On the other hand, gold is expected to find immediate support near 1,782. A breakout at the 1,782 level would move gold to the next support level of 1,776, and below that, the 1,765 level will be the next support level.
The 1,792 level remains the immediate resistance for the pair. Gold prices will be exposed to the 1,798 level if a bullish breakout occurs, with the next resistance level being around the 1,811 level. It is anticipated that the 50-period SMA (simple moving average) in the 4-hour time frame will prolong resistance around the 1,811 level.
Finally, the RSI shows that GOLD has a negative bias. As a result, the bearish bias in the precious metal is still strong below 1,794, and vice versa. Good luck!