Polkadot, Litecoin Price Prediction – DOT Heads for ATH, Good Buying Opportunity in LTC
Polkadot keeps progressing higher toward new highs, Litecoin retreats before the next jump

Polkadot has been in the group of cryptocurrencies that have been showing resilience during September and October, unlike most of the market which was stagnating. This crypto bottomed out at around $10 during the May/June crash and eventually, it started reversing up together with the crypto market in late July.
DOT/USD gained around 400% as the price got pretty close to $40 on that climb, which last during September as well, when the rest of the market was retreating lower. The price retreated from there, but the retreat ended at the 200 SMA (purple) on the daily chart, whih turned into a solid support indicator.
Polkadot Daily Chart Analysis

May’s high is the next target for Polkadot
In October, Polkadot coin resumed the bullish trend again, following Bitcoin higher, pushing above the $40 resistance and now trading at $46, as shown on the chart above. The release of the parachains with the latest update and the announcement of the new parachain auction which will start in November has increased the attention toward Polkadot, which is keeping DOT coin on bullish momentum.
Besides that, the sentiment in the market has improved, so there is more room for DOT/USD to run to the upside. The all-time high (ATH) just below $50 is the next target now and Polkadot is headed that way, so I don’t think it will take too long considering the pace of the uptrend.
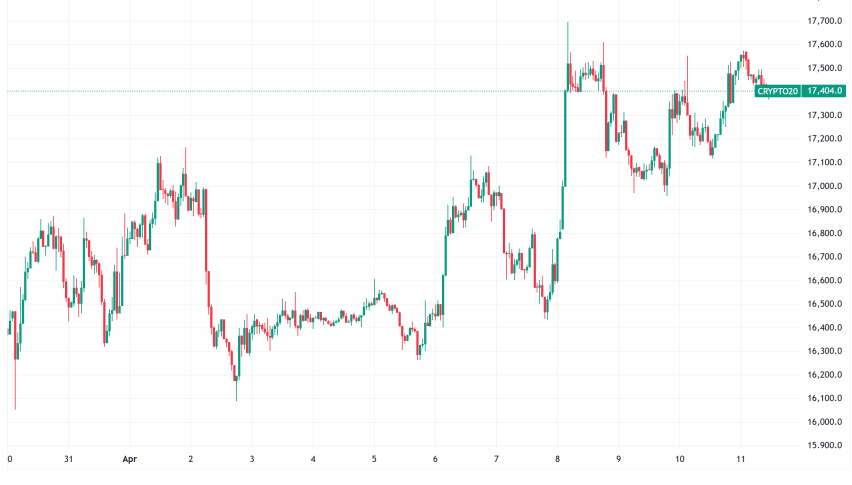
Litecoin Daily Chart Analysis – LTC/USD Retreats to the 20 SMA

Will the 200 SMA turn into support for LTC/USD now?
Litecoin made a major bullish break earlier this week. The 200 daily SMA (purple) has been acting as resistance for more than two months, despite the two quick breaks and reversals down. But, on Wednesday, Litecoin finally made a clear break of this moving average, as Bitcoin pushed above the all-time highs of $65,000. Yesterday we saw a pullback lower and the price has retreated below $200 again, while the 200 SMA stands below and might turn into support if the retreat continues.
Litecoin H4 Chart Analysis

Will LTC/USD bounce off the 20 SMA now?
On the H4 chart, we see that moving averages have turned into support for Litecoin and the jump higher on Wednesday took place off the 20 SMA (gray) on this timeframe. Yesterday the price retreated lower, but today the 20 SMA seems to be acting as support again. The retreat has stalled here and the stochastic indicator at the bottom is almost overesold. So, this looks like a good opportunity to go long on LTC/USD at the 20 SMA, hoping that the price will bounce higher soon and resume the bullish trend.
Litecoin Live Chart
- Check out our free forex signals
- Follow the top economic events on FX Leaders economic calendar
- Trade better, discover more Forex Trading Strategies
- Open a FREE Trading Account
- Read our latest reviews on: Avatrade, Exness, HFM and XM
Related Articles

Sidebar rates
Related Posts
