The [[
XRP/USD]] coin managed to put a stop to its sharp overnight declines and hit the intra-day high of 0.84411. The XRP/USD coin has been trading in the bullish zone since the day started, which could be attributed to the latest recovery in the cryptocurrency market. Today, the price of XRP is $0.837697 USD, with a 24-hour trading volume of $3,261,514,206 USD. In the last 24 hours, XRP has been up 7.50 percent. The gains were achieved after the BTC coin managed to end its bearish bias of the previous day and climb back to the $51,000 level.
Last weekend, the value of XRP plummeted by more than 30%, bringing it back to $0.60. According to sources, one institution sold over $500 million in Bitcoin, sparking “aggressive liquidations” in the crypto derivatives market, and an accompanying price drop. The losses, however, were short-lived, with prices recovering significantly later in the session. This is because public opinion on cryptocurrencies remains positive, and the market sentiment is improving, as indicated by Tuesday’s risk-on mood.Meanwhile, the weakness of the broad-based US dollar was one of the critical factors that further boosted the XRP/USD prices. In Asia, the dollar was lower on Tuesday morning, as the hopes of finding a cure for the South African covid strain, known as Omicron, boosted the market sentiment, undermining the safe-haven demand.
This eased concerns about the economic consequences of the Omicron variant and restored investor confidence, as seen by a positive tone in the equities markets. Thus, the prevalent upbeat market mood undermined the US dollar, which was seen as a key factor that provided a modest lift to the [[XRP/USD]] pair.

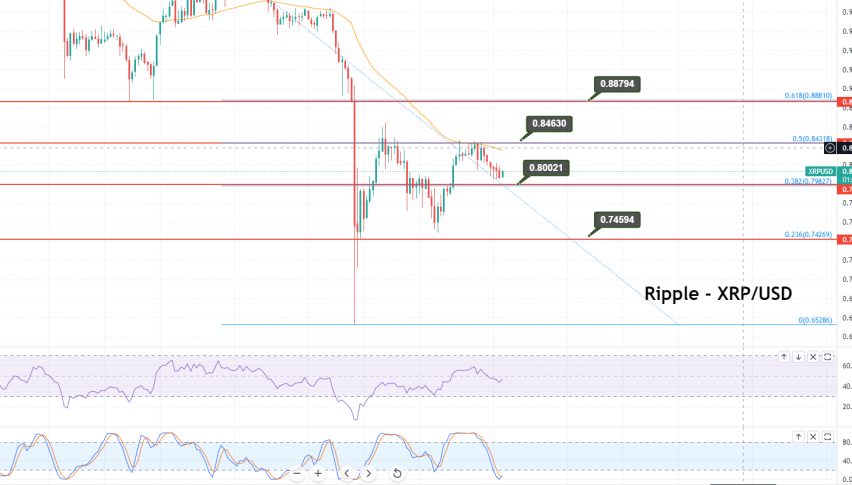
Ripple – A Technical Outlook; XRP Retests the 50% Fibonacci Retracement
On the 2-hourly timeframe, XRP/USD is steady below the resistance level of $0.8465. It is currently trading at the $0.8110 level, crossing below the 20 and 50-day simple moving averages, with resistance at $0.8432.
Lately, the [[ XRP/USD]] has closed a “bearish engulfing” pattern, indicating a spike in selling pressure among investors. Therefore, the selling bias dominates below the $0.8435 level.
The double top pattern on the 4-hour timeframe is likely to act as a significant resistance at $0.8465. A breakout at the $0.8465 resistance level could drive a bullish trend until levels of $0.8880 or $0.9600. Conversely, a violation of the $0.8000 support zone could trigger a sell-off until 0.7560. So let’s keep an eye on $0.8000, as the bearish bias dominates below this level and vice versa. Good luck!


