Decisive Time for Ethereum (ETH), Litecoin (LTC) Buyers at Resistance
Litecoin (LTC) and Ethereum (ETH) have made some decent gains in recent days, but they are facing strong resistance above
Cryptocurrencies stopped declining in late January, after being in a bearish trend for nearly three months, and in the last several days, they have been running higher, making considerable gains, with Bitcoin climbing above $45,000 today, before retreating somewhat. Ethereum and Litecoin have displayed some bullish momentum as well recently, suggesting that the bullish trend might be back on, but they are facing resistance indicators to the top now, which will decide whether buyers are going to resume the larger bullish trend, or if the bearish period will continue.
Ethereum Daily Chart Analysis – ETH Faces the 50 SMA to the Top
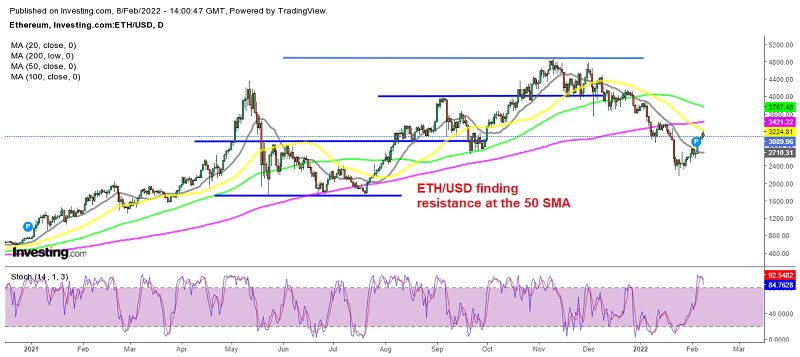
Ethereum almost reached $5,000 by early November, after being bullish since August. But, it failed to take out that major level, and has been declining since then. The retreat has been steep, with the 20 daily SMA (gray) showing it, since it has been acting as resistance during this time. ETH/USD fell below $2,200 last month, but it has climbed around $1,000 in the last few days, as buyers finally reappeared.
Last week we saw a loss of 20,000 ETH coins, with a value of over $322 million, during the attack on the Wormhole bridge protocol, which connects the Ethereum and Solana blockchains. This was the second biggest hack in the DeFi sector. Ethereum founder Vitalik Buterin announced that he is planning to tackle scaling and gas issues by adding a blob-carrying transaction feature in a hard fork, which will be launched soon. However, at the moment the market sentiment is driving the Ethereum prices, and buyers are now facing the 50 daily SMA. If the 50 SMA rejects it and the 20 SMA turns into support, we might attempt to buy ETH down there.
Litecoin Daily Chart Analysis – LTC Facing the $140 Support/Resistance Zone

LTC remains in the bearish zone
Litecoin failed to push above the $300 level in November, after a quick spike higher back then, and it has lost around two-thirds of its value during the bearish period in the market over the last three months. But the last support zone at $100 held the decline again in LTC, and now we are seeing an attempt by LTC buyers to reverse the trend.
However, they are facing the previous support zone above $140, which might turn into resistance. Litecoin does have a reason to rally, after the MimbleWimble (MWEB) upgrade, which should make Litecoin more scalable and secure. The mining hashrate has also been increasing steadily for Litecoin, but the market sentiment is the main driver here as well, and this will be the deciding factor for Litecoin.
Litecoin LTC Live Chart
- Check out our free forex signals
- Follow the top economic events on FX Leaders economic calendar
- Trade better, discover more Forex Trading Strategies
- Open a FREE Trading Account
- Read our latest reviews on: Avatrade, Exness, HFM and XM
Related Articles
Sidebar rates
Related Posts
