DAX Technical View: Market Facing Overbought Hurdle after Placing All-Time High
The market has had an impressive 7 candle consecutive run, taking the index to a new all-time high of 18848.
The market has had an impressive 7 candle consecutive run, taking the index to a new all-time high of 18848.
The DAX started the year with a consistent rally after the first two weeks of January when it drifted slightly lower. The market steamrolled ahead to the previous high of 18634 on April 1, from which it retraced to 17397 before regaining new momentum to reach its new peak.
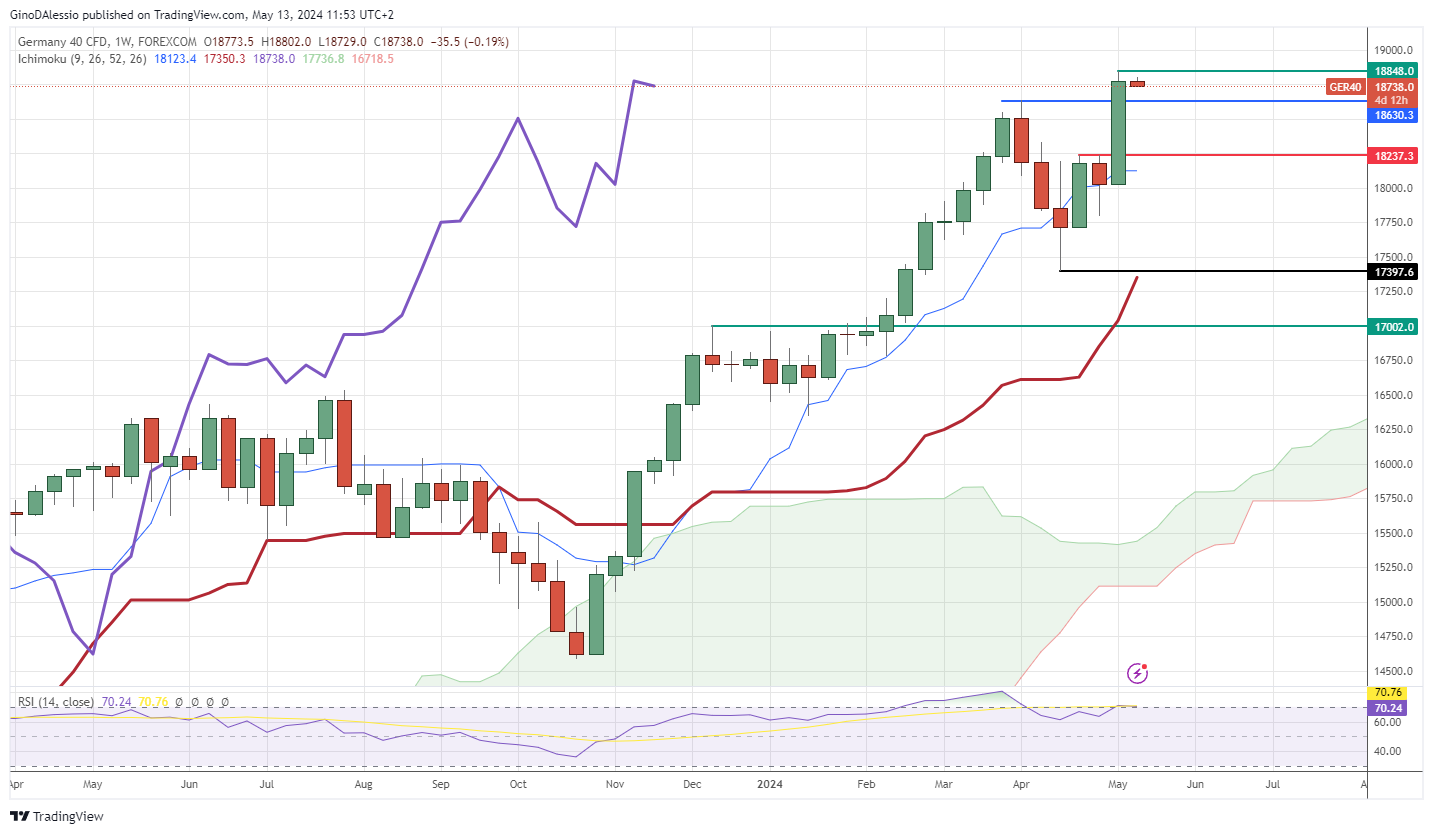
Weekly Chart
The weekly chart below shows a bullish trend is still in place, even though the RSI is struggling to break above 70. An RSI above 70 denotes a strong bullish trend, albeit in overbought territory. Failure to break above 70 may indicate weakness in the trend and give way to a correction.
Day Chart
From the day chart we can see how the market is struggling to break above an RSI of 70. Notice how the previous leg of this rally took the RSI above 70, which indicated the strength of the momentum.
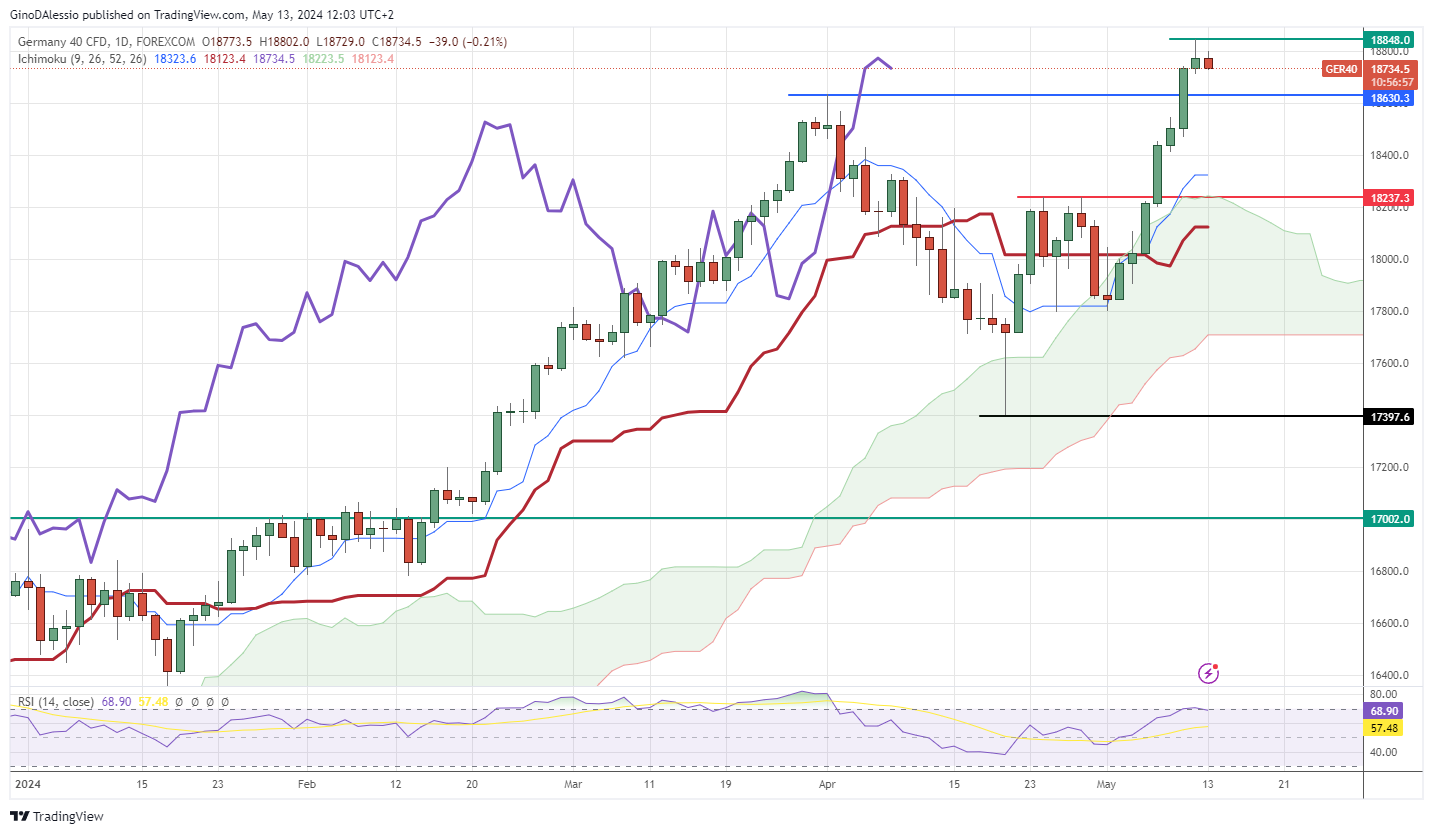
That rally from February 15 to April 1, was sustained by an RSI almost always above 70. This reading indicated the strength of the bullish run. Looking at the most recent candles on the chart, we can see how the rally seems to be faltering after hitting an all-time high.
If the following day candles for this week fail to keep the RSI above 70 we may see the market correct lower. That wouldn’t mean the bull trend is over, but it could give rise to lower prices while the market consolidates for a new run higher.
4-Hour Chart
The 4-hour chart below shows the last part of the rally to the market’s recent all-time high. The rally was sustained by the RSI well above 70 throughout the run. The previous red candle is the first time the RSI has dipped below 70 since the rally broke out.
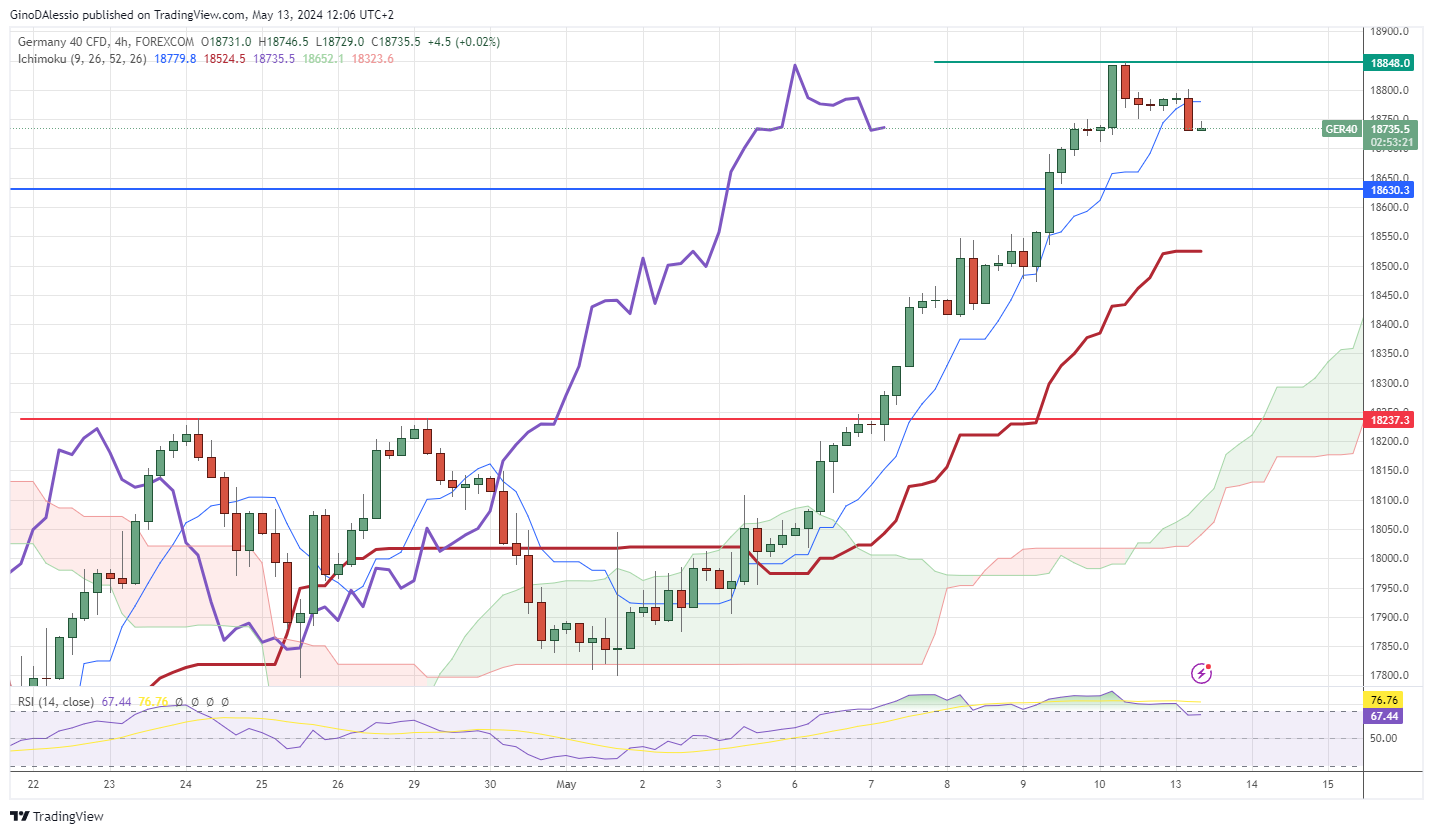
I expect this RSI level to signal some retracement, the next support would be at 18630. If that level breaks the next level for support would be at the Kijun line (crimson) at 18524. For the market to regain its bullish momentum we would need to see a close above 18848, at least on the 4-hour chart.
- Check out our free forex signals
- Follow the top economic events on FX Leaders economic calendar
- Trade better, discover more Forex Trading Strategies
- Open a FREE Trading Account
- Read our latest reviews on: Avatrade, Exness, HFM and XM
Related Articles


Sidebar rates
Related Posts
