Robinhood Markets, Inc. (HOOD) has experienced a pronounced uptrend since the close of last year, signaling a resurgence in market sentiment. Over the past two months, the stock has seen an exceptional rally, with its price nearly doubling.
Robinhood (HOOD) Surges By Nearly 91 % Since August
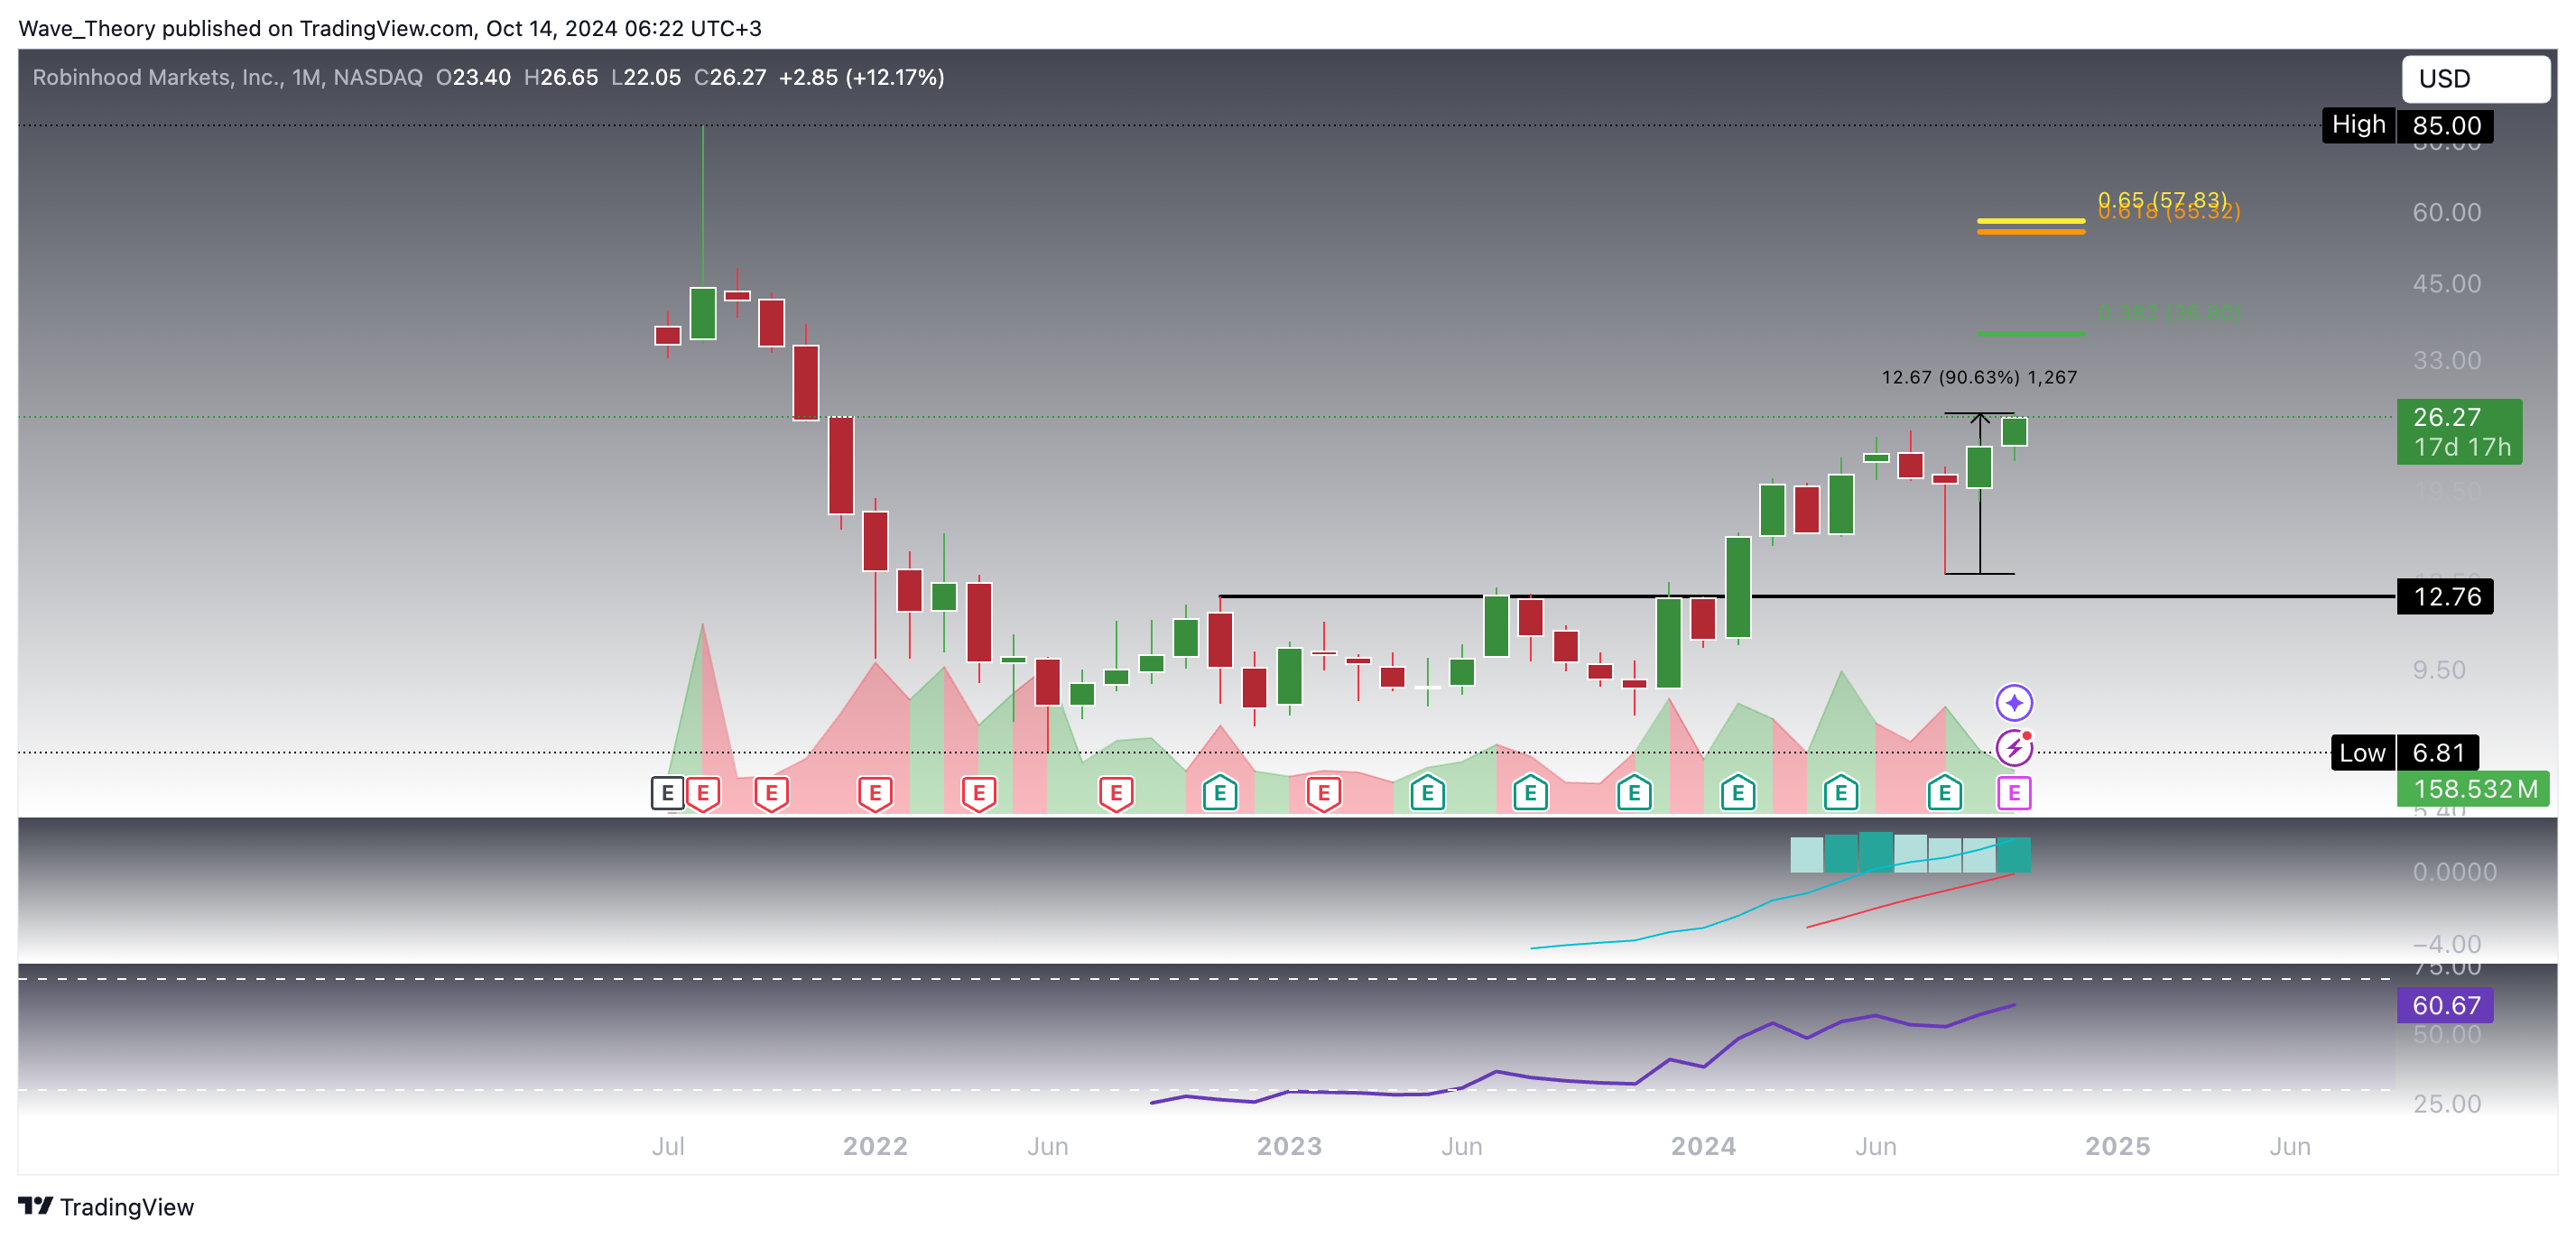
Robinhood (HOOD) has seen a remarkable surge of nearly 91% since hitting a local low around $14 in August. This rapid recovery and subsequent breakout past its previous highs signal strong bullish momentum, which is now reflected in key technical indicators on the monthly chart.
The next critical Fibonacci resistance levels for Robinhood (HOOD) are at $36.8 and $57.5. A break above the golden ratio at $57.5 would be a major bullish signal, indicating a shift back into a full bull cycle. This could pave the way for further upward momentum, potentially attracting more institutional buyers and reinforcing a longer-term positive trend. However, these levels serve as significant resistance points, and overcoming them will require sustained bullish momentum.
Technical Indicators and Trends (Daily Chart):
MACD (Moving Average Convergence Divergence): The MACD lines are currently in a bullish crossover, with the histogram ticking upwards this month, reinforcing the upward trend. This suggests that momentum is building in favor of the bulls.
RSI (Relative Strength Index): While the RSI is approaching overbought territory, it remains within the neutral zone. This indicates that the stock still has room for further upside without triggering a significant reversal in the immediate term.
The combination of the bullish MACD and a moderately positioned RSI indicates that the stock has the potential to continue its upward trajectory. However, as the RSI nears the overbought zone, it’s crucial to watch for any signs of weakening momentum that could trigger a pullback or consolidation in the near term.
Robinhood
Is There More Upside For The Robinhood Stock?
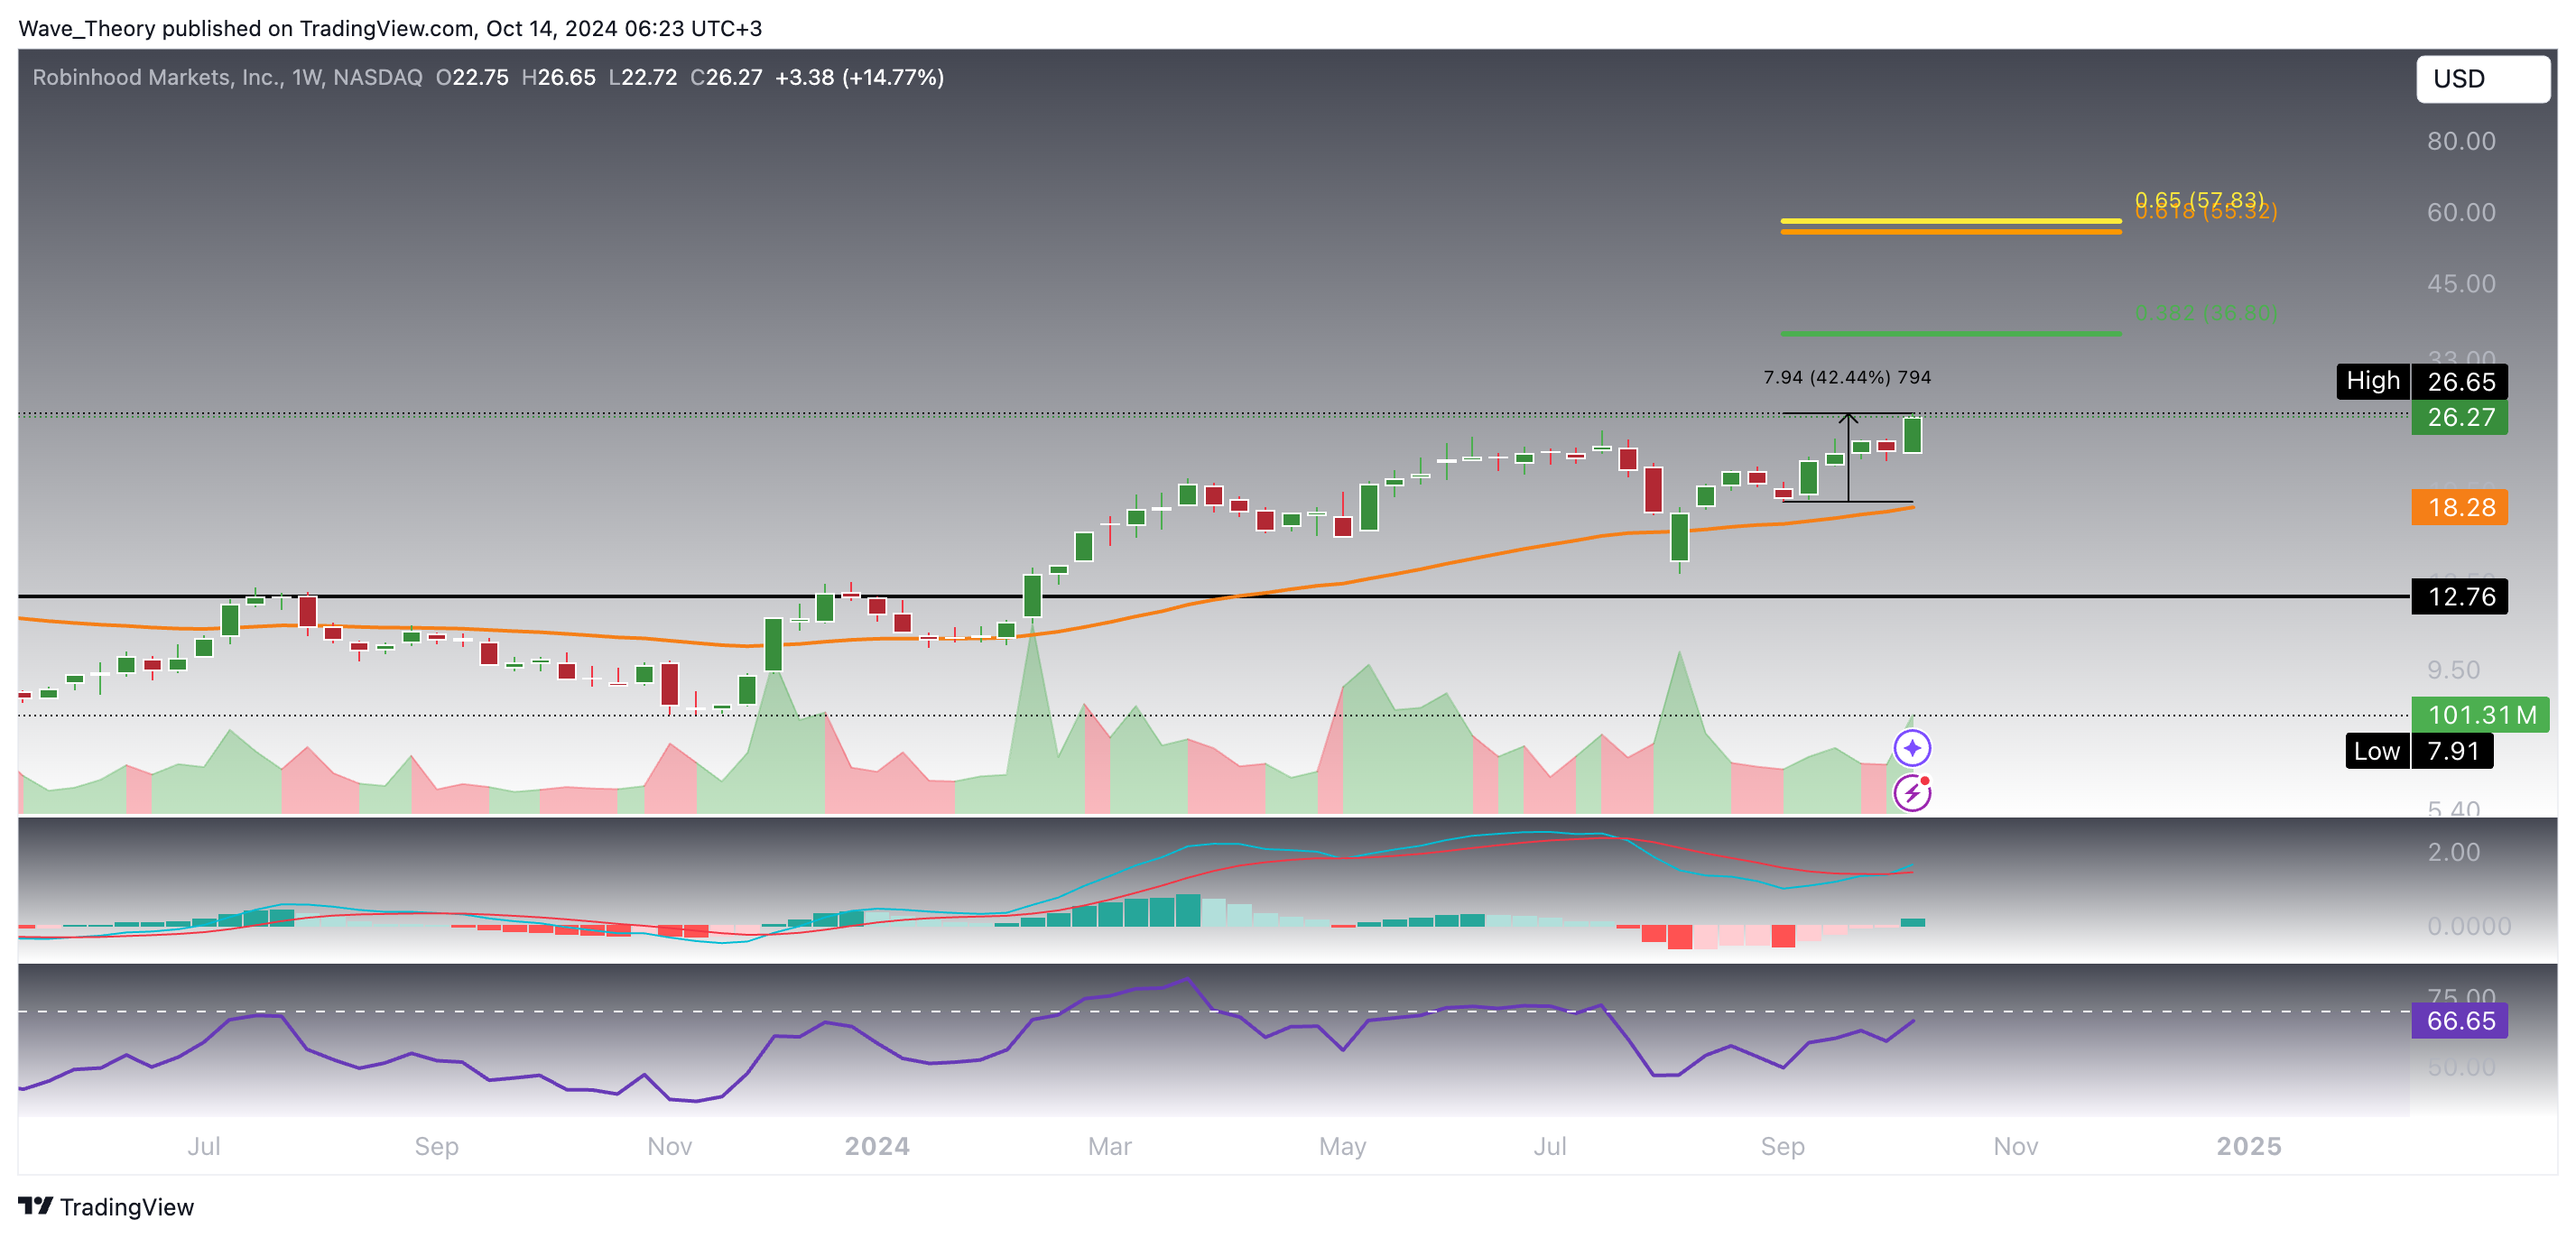
The recent surge in Robinhood (HOOD) stock, which has increased by around 42.5% since early September, indicates strong bullish momentum. However, it’s essential to assess whether there is further upside potential, especially given current technical signals.
Technical Indicators and Trends (Weekly Chart)
MACD (Moving Average Convergence Divergence): The MACD is in a bullish crossover, and the histogram continues to rise. This supports a bullish outlook in the near term, suggesting that momentum is still favoring buyers.
RSI (Relative Strength Index): The RSI is nearing overbought levels, which introduces caution. There’s a potential for a bearish divergence—a signal where the price continues to rise, but the RSI starts to decline. This could indicate a future pullback, though it hasn’t materialized yet.
50-week EMA (Exponential Moving Average): The 50-week EMA, currently at $18.3, is acting as a key support level. As long as the price remains above this moving average, the trend remains intact. Should a pullback occur, this level would be crucial to watch as a potential area for buyers to re-enter.
While the current technical indicators on the weekly chart paint a bullish picture for HOOD, the proximity of the RSI to overbought levels and the possibility of a bearish divergence signal that traders should watch for signs of weakening momentum.
Robinhood
Robinhood (HOOD) Stock: Key Support Levels To Watch
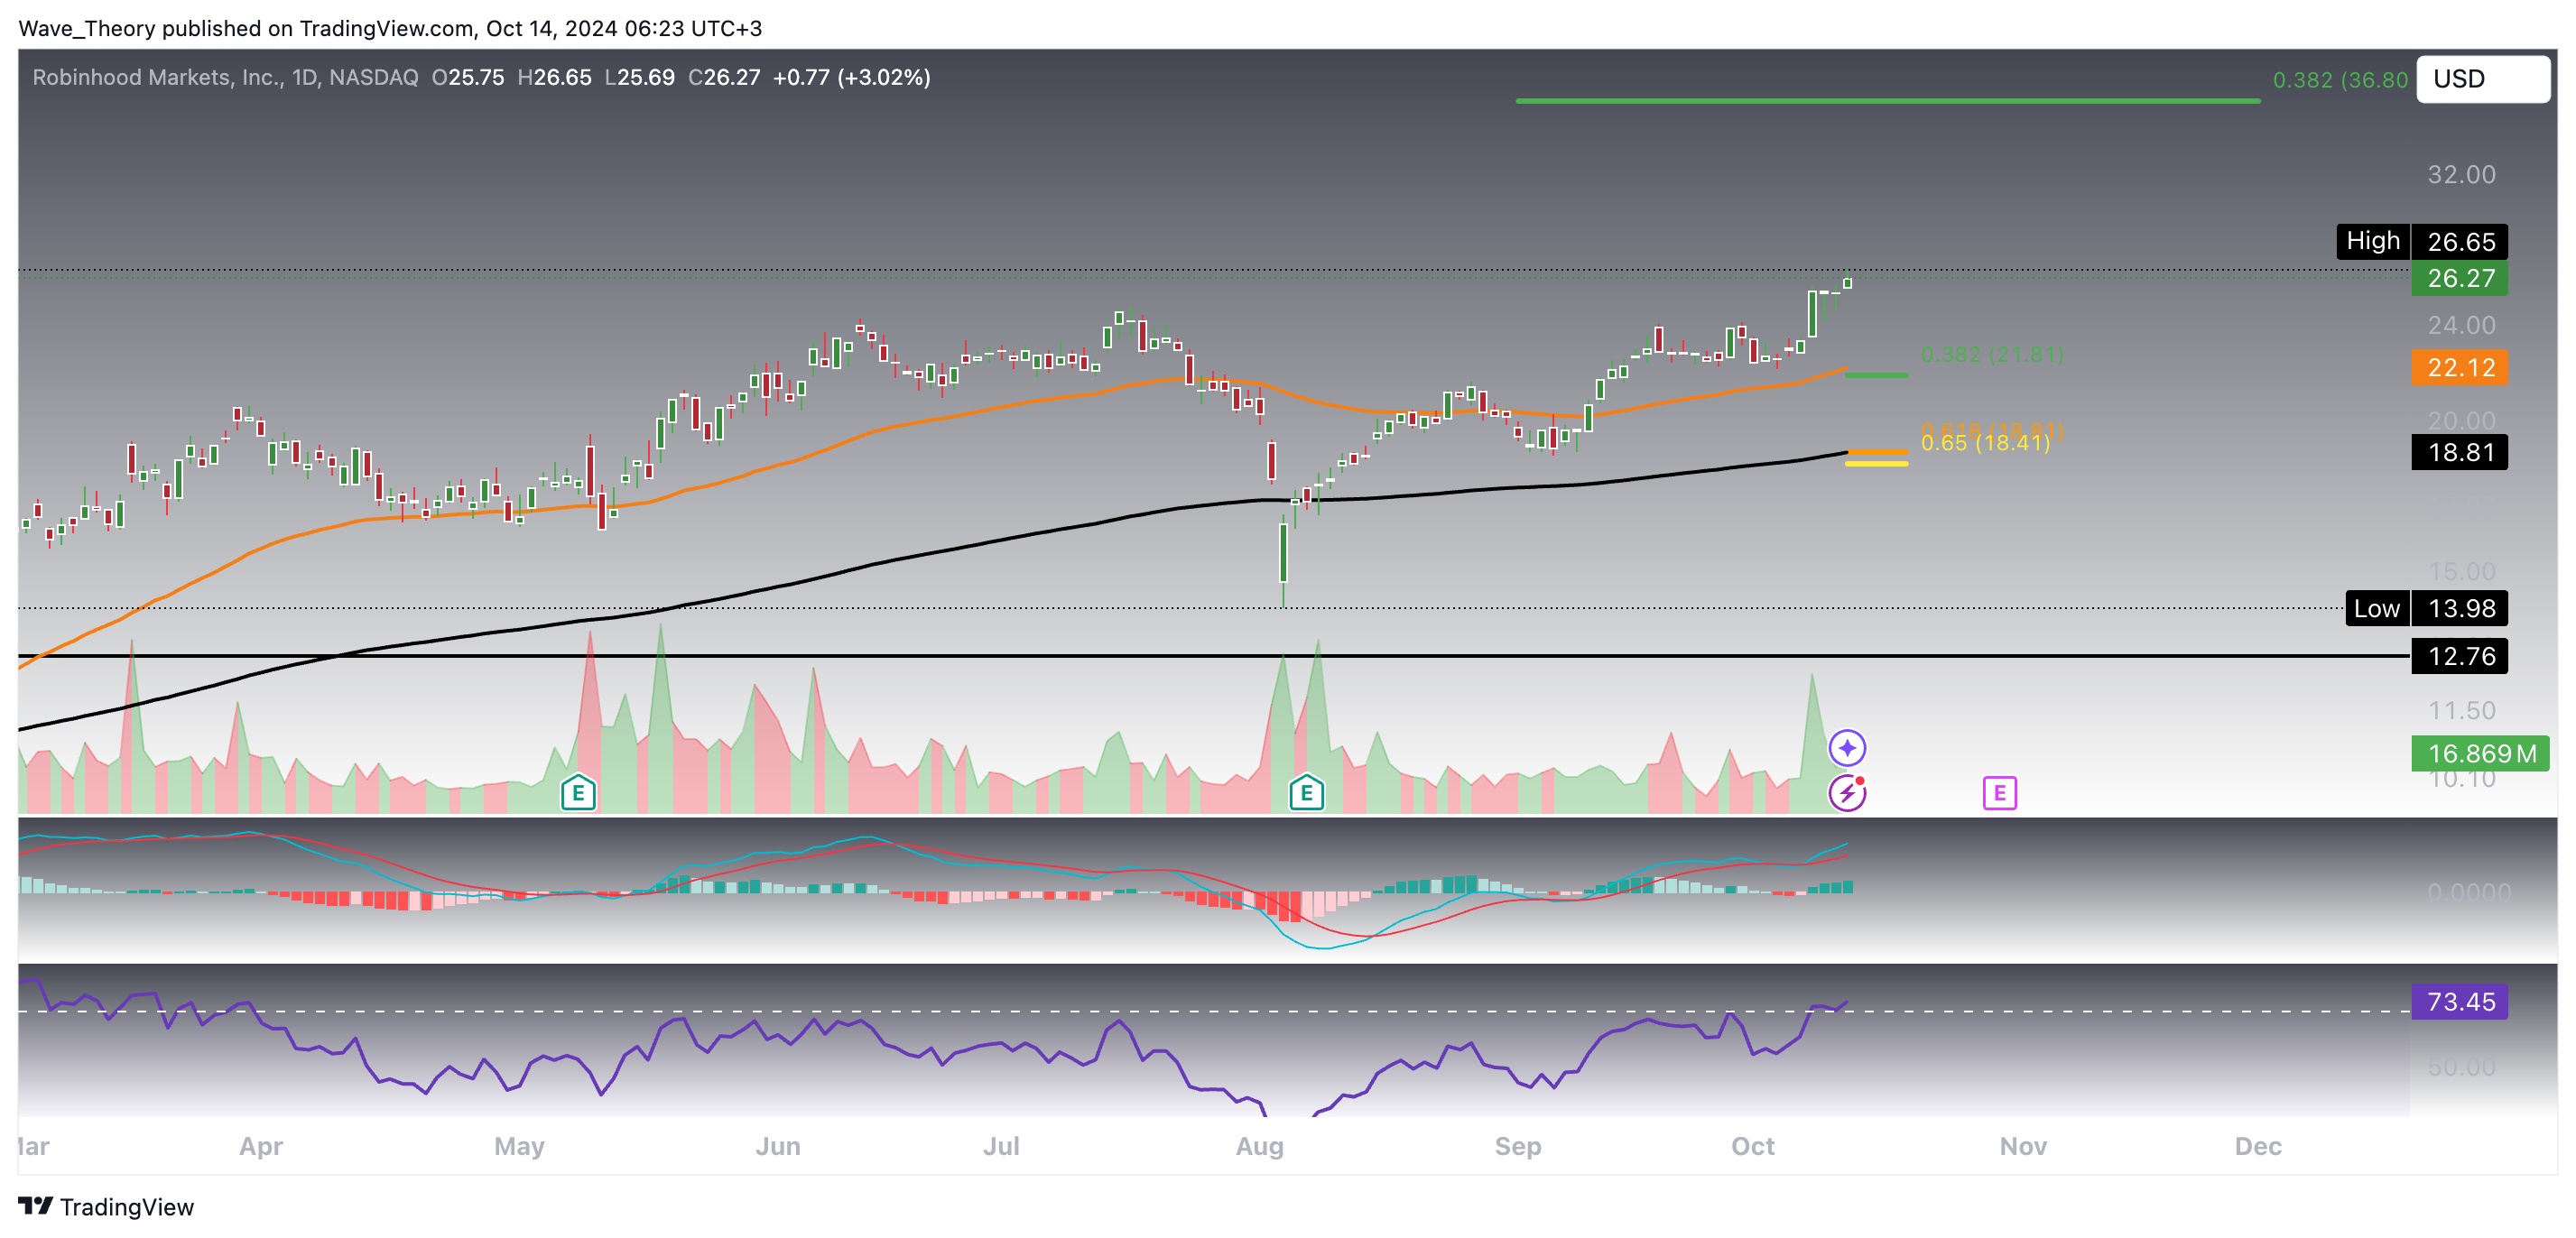
In the event of a sudden downside move, Robinhood stock has key Fibonacci support levels to monitor at $21.81 and $18.4. These levels align with important technical supports:
The 50-day EMA and 200-day EMA, which coincide with these Fibonacci levels, provide additional reinforcement.
These zones would be critical for any potential buyers looking for re-entry points should the stock see a correction.
Technical Indicators and Trends (Daily Chart):
MACD (Moving Average Convergence Divergence): The MACD lines are bullishly crossed, and the histogram has been ticking higher for several days, maintaining a strong bullish outlook.
RSI (Relative Strength Index): The RSI has entered overbought territory, but notably, it hasn’t shown a bearish divergence, meaning the momentum remains intact.
EMA (Exponential Moving Average): The golden crossover of the 50-day and 200-day EMAs signals a continuation of the bullish trend in the short to mid-term. This is typically a strong indicator of positive momentum and suggests further upside potential despite market fluctuations.
Robinhood
Will Robinhood Reach The Next Fib Level?
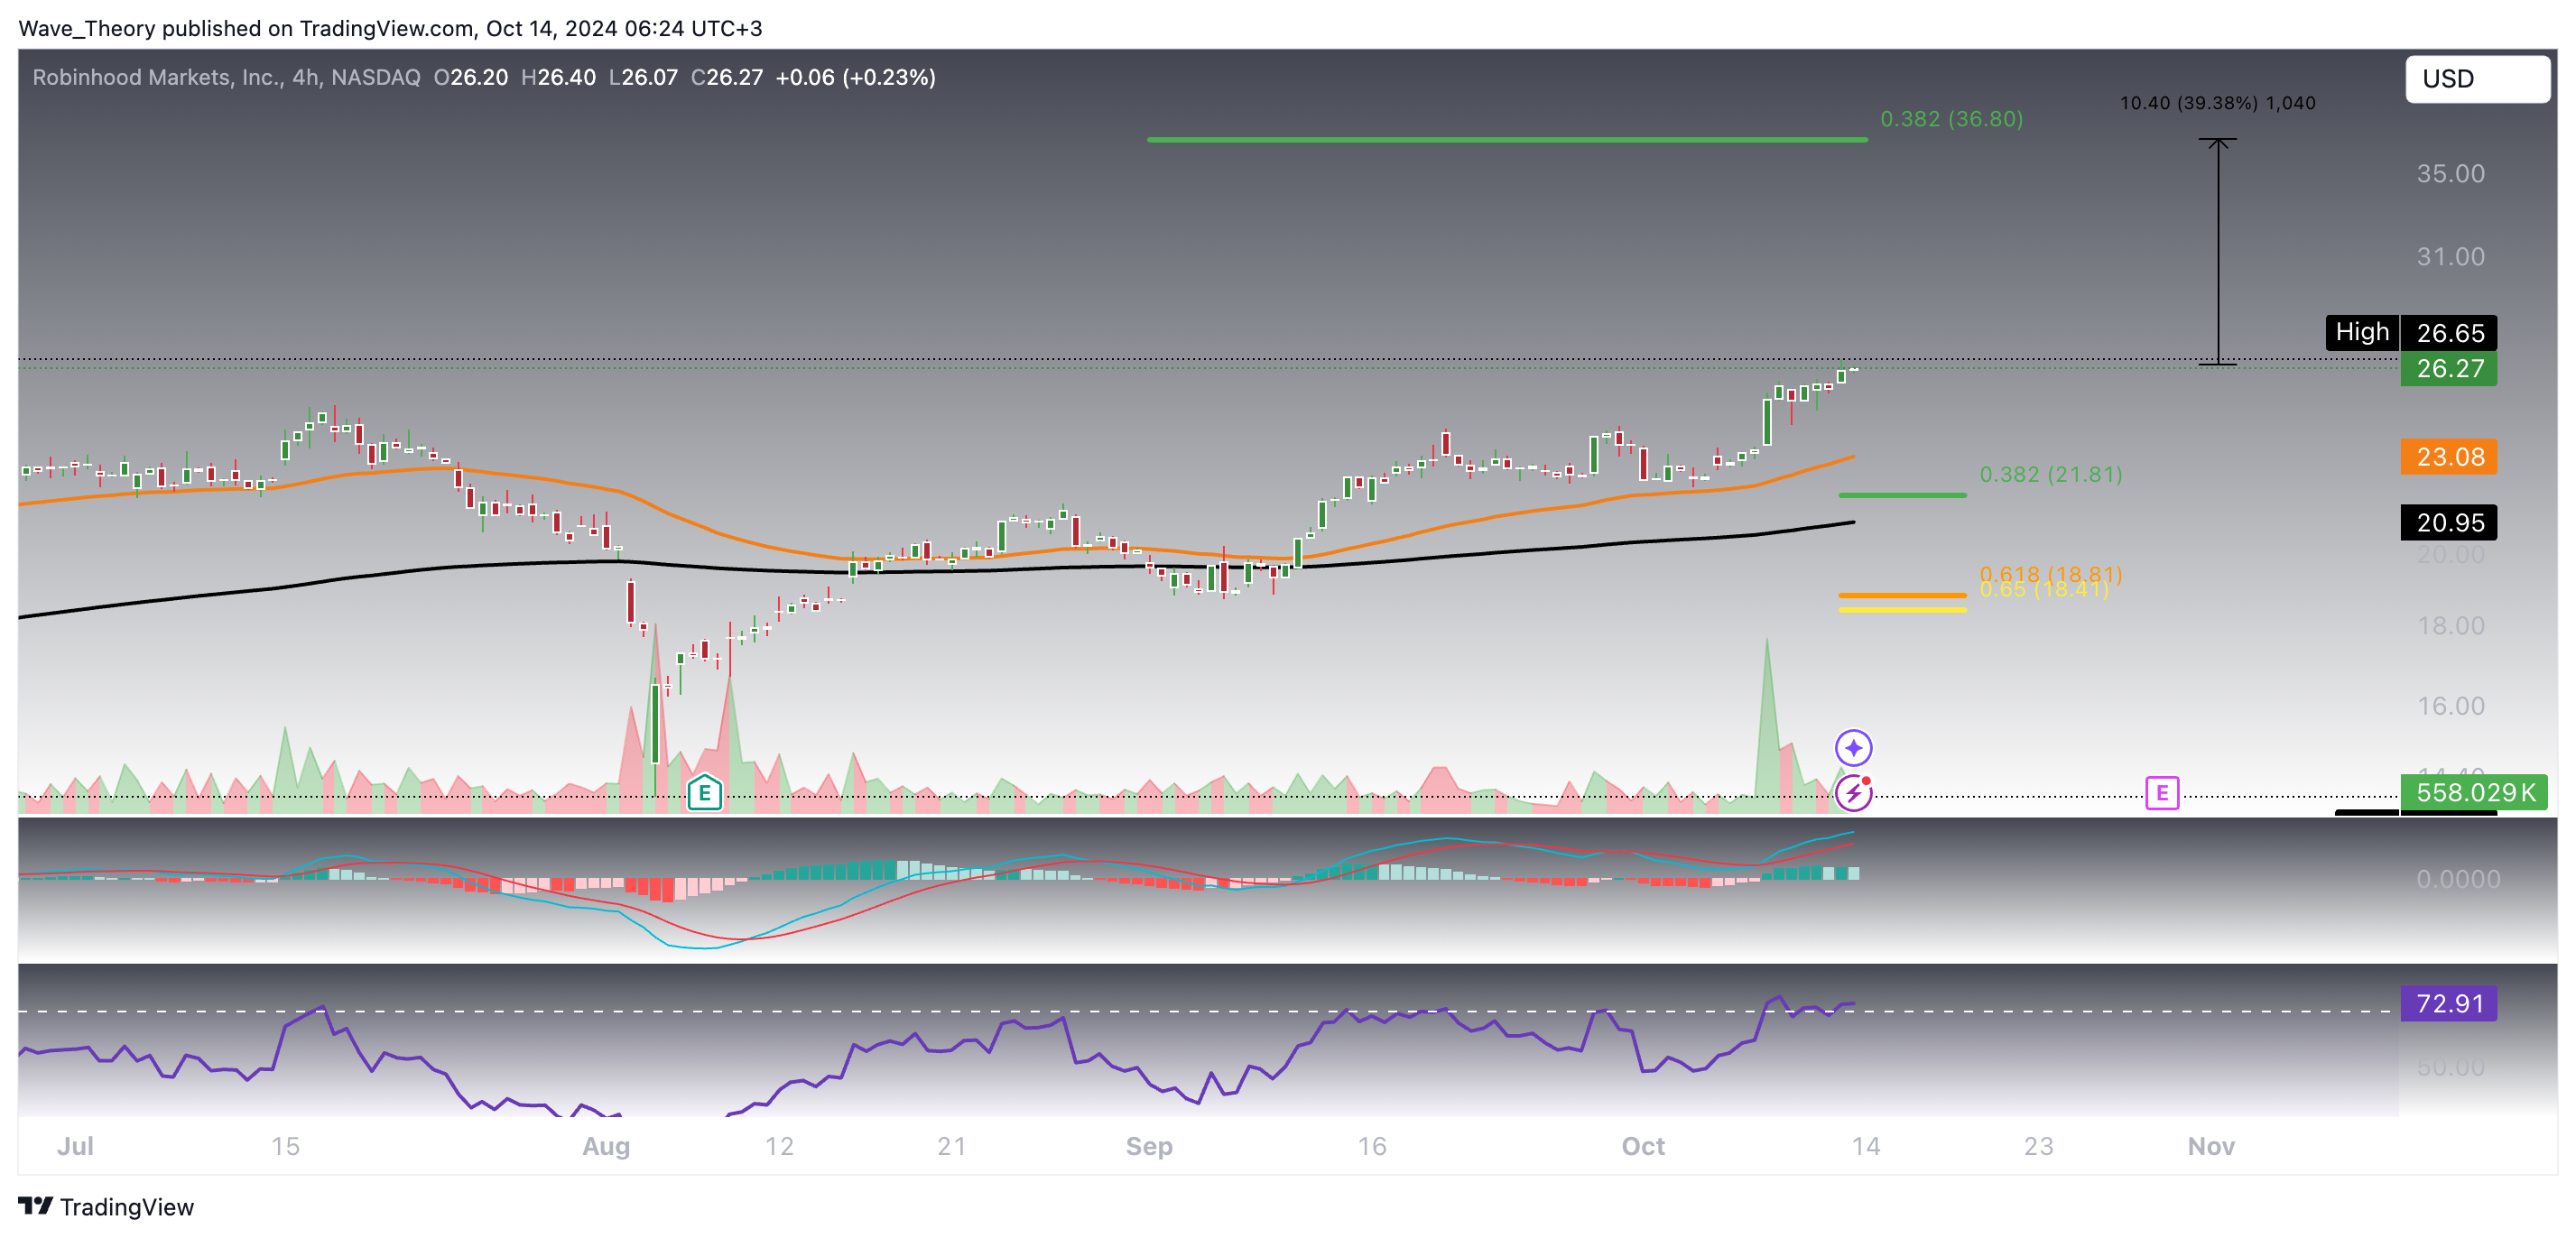
Robinhood (HOOD) shows strong upside potential, with the next significant Fibonacci resistance at $36.8, indicating roughly 40% growth from current levels. The short-term outlook remains bullish, supported by favorable technical indicators.
Technical Indicators and Trends (4H Chart):
MACD (Moving Average Convergence Divergence): The MACD lines are in a bullish crossover, signaling upward momentum. However, the histogram is fluctuating between bullish and bearish ticks, which suggests some near-term volatility.
RSI (Relative Strength Index): The RSI has reached overbought territory but is not currently signaling a bearish reversal. This suggests that, while the stock may be temporarily overextended, the bullish trend remains intact.
EMA (Exponential Moving Average): The golden crossover of the 50-day and 200-day EMAs on the 4-hour chart confirms the bullish momentum, indicating further upside potential in the short term.
Robinhood
Robinhood (HOOD) shows strong short-term upside potential, with a key resistance level at $36.8. While bullish indicators like the MACD and EMAs support continued momentum, the overbought RSI suggests traders should be mindful of possible short-term corrections before a final push to the target.
Konstantin Kaiser comes from a data science background and has significant experience in quantitative trading. His interest in technology took a notable turn in 2013 when he discovered Bitcoin and was instantly intrigued by the potential of this disruptive technology.