Forex Signals Brief October 30: Will ADP Employment Send the USD Lower Today?
Today we have the US ADP employment which will take the headline after the soft JOLTS jobs yesterday raised questions about US employment.

Today we have the US ADP employment which will take the headline after the soft JOLTS jobs yesterday, since the calendar in the European session was empty. In early U.S. trading, the dollar initially extended its recent strength, but this momentum faded over the session. Contributing to this shift was a softer JOLTS report, which revealed the lowest quit rate since 2015, barring the pandemic period. While this headline number was subdued, weather events such as hurricanes may have had an impact.

Although consumer confidence showed an unexpected boost, it was somewhat overshadowed by the JOLTS data. The commodity-linked currencies also struggled, following news from Reuters of China’s substantial 10 trillion yuan stimulus package. Although this figure aligns with analysts’ expectations, the stimulus will be allocated over a three-year period, making the specifics important for market sentiment.
Today’s Market Expectations
Today started with the CPI inflation report from Australia. For September, the headline Consumer Price Index (CPI) showed an increase of 2.8% year-over-year, slightly below the forecast of 2.9% and reflecting a deceleration from August’s 3.8% annual growth. In the July to September quarter, the quarter-over-quarter CPI increased by 0.2%, which is just under the expected 0.3% and down from the previous quarter’s increase of 1.0%. The Trimmed Mean CPI, which captures core inflation trends, remained steady at 3.5% year-over-year, matching expectations but showing a decline from the prior rate of 3.9%. On a quarter-over-quarter basis, the core inflation rose by 0.5%, which fell short of the anticipated 0.8% and was also down from the previous quarter’s increase of 0.8%.
In October, the U.S. ADP report is expected to show 110,000 jobs added, down from 143,000 in September. This comes as interest rate expectations were repriced with a hawkish tilt following recent data surprises. Although the ADP report has a mixed record in predicting the NFP report, the market’s heightened sensitivity to labor data gives it added weight this time.
The U.S. GDP for Q3 is expected to show a 3.0% growth rate, matching the previous quarter. This likely reflects overall improvement in the U.S. economy since early in the year. Consumer spending—especially on services—has been a major growth driver, though exports and the housing market have been notable drags. However, if the labor market continues to weaken, consumer spending could slow, which would place downward pressure on future GDP growth, despite lower borrowing costs.
Yesterday volatility picked up, although we saw several reversals in the main forex pairs, which offered many trading opportunities. As a result, we opened 12 trading signals, 9 of which were winning forex signals and only three losing trades. Commodity dollars kept declining so we kept selling them, while Gold made new highs so we remained long, which proved to be a good trading strategy.
The 50 SMA Keeps Supporting Gold
Gold continued its upward trend today, reaching $2,774 following weaker-than-expected U.S. JOLTS job openings data. Political factors, including the upcoming U.S. presidential election, are also bolstering gold’s rise, with projections suggesting it may approach $2,800 and possibly even $3,000. On the H4 chart, smaller moving averages, such as the 20 SMA (gray) and 50 SMA (yellow), are providing solid support, indicating strong buying pressure. Since starting the year at roughly $2,000, gold has gained nearly 25%.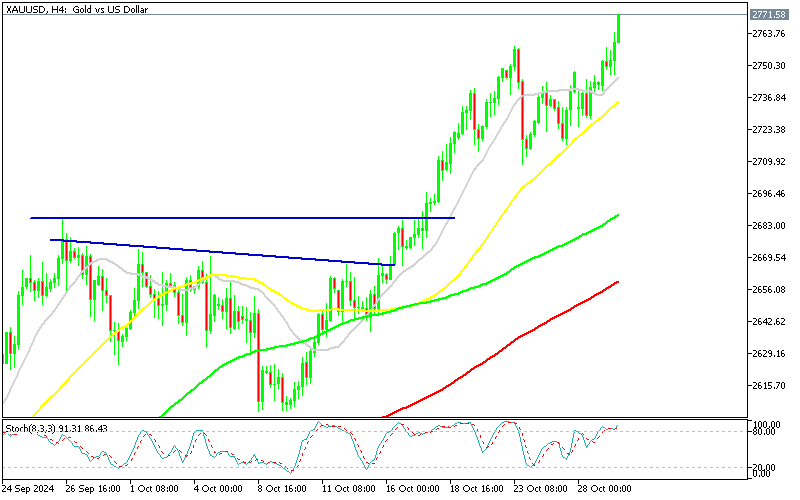
XAU/USD – H4 Chart
EUR/USD Trying to Climb Above the 50 SMA
The USD/EUR exchange rate, which has been trending lower in October, fell to the 1.0760s last week. After the JOLTS report, the pair initially dropped but quickly rose above 1.08. Resistance from the 50 SMA (yellow) is still holding on the H4 chart, yet the recent data sparked renewed efforts to counter the downtrend, signaling a potential bullish breakout.
EUR/USD – H4 Chart
Cryptocurrency Update
Bitcoin Retests All Time Highs

BTC/USD – Daily chart
Ethereum Climbs Above $2,500
Ethereum has also shown strong buying momentum, with prices breaking above the 100-day SMA to reach $2,700 in October. After a minor dip on Tuesday, Ethereum found support at the 50-day SMA, maintaining its position above $2,500 and reflecting resilience within its current upward trend.
ETH/USD – Daily chart
- Check out our free forex signals
- Follow the top economic events on FX Leaders economic calendar
- Trade better, discover more Forex Trading Strategies
- Open a FREE Trading Account
- Read our latest reviews on: Avatrade, Exness, HFM and XM
Related Articles


Sidebar rates
Related Posts
