D-Wave Quantum Inc. (NYSE: QBTS) Surges By Over 1,070 % In Only Two Months
QBTS Stock Surged By 2,780 % Since Summer 2023
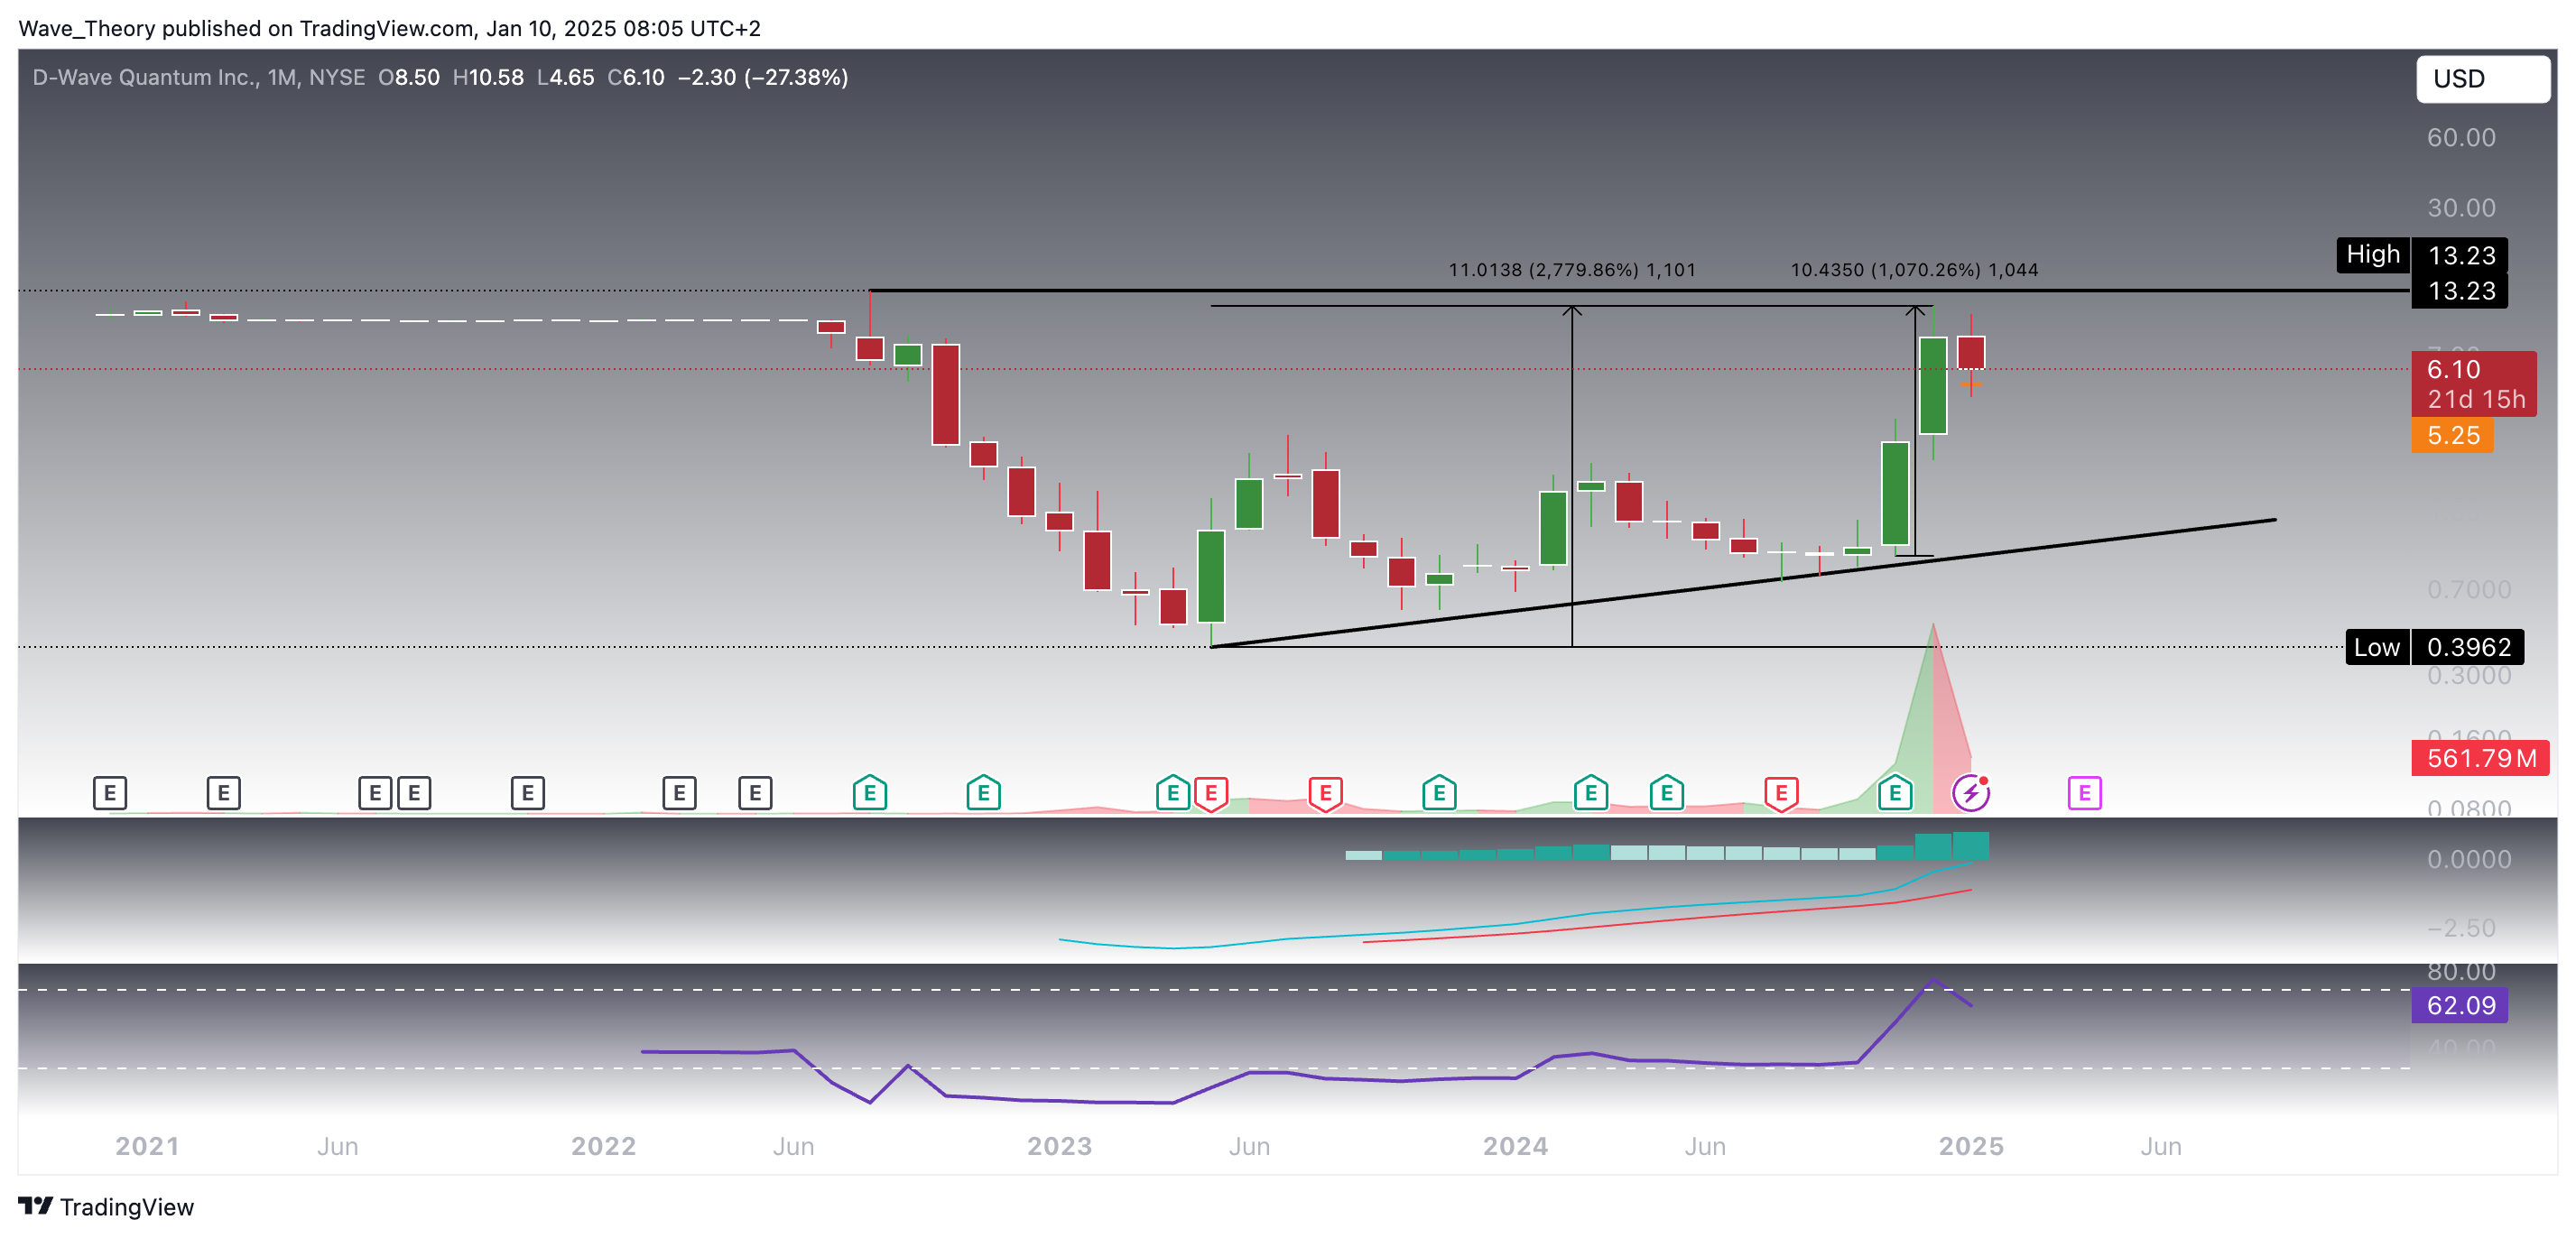
Since its low in the summer of 2023, QBTS stock has experienced an extraordinary surge of 2,780%, marking an exceptional rally. In the past two months alone, the stock has gained over 1,070%, showcasing an impressive short-term uptrend. Despite this rapid ascent, the stock has yet to reach its all-time high (ATH) of $13.23, which remains intact as a key resistance level.
QBTS Stock Reaches Important Fibonacci Support Level
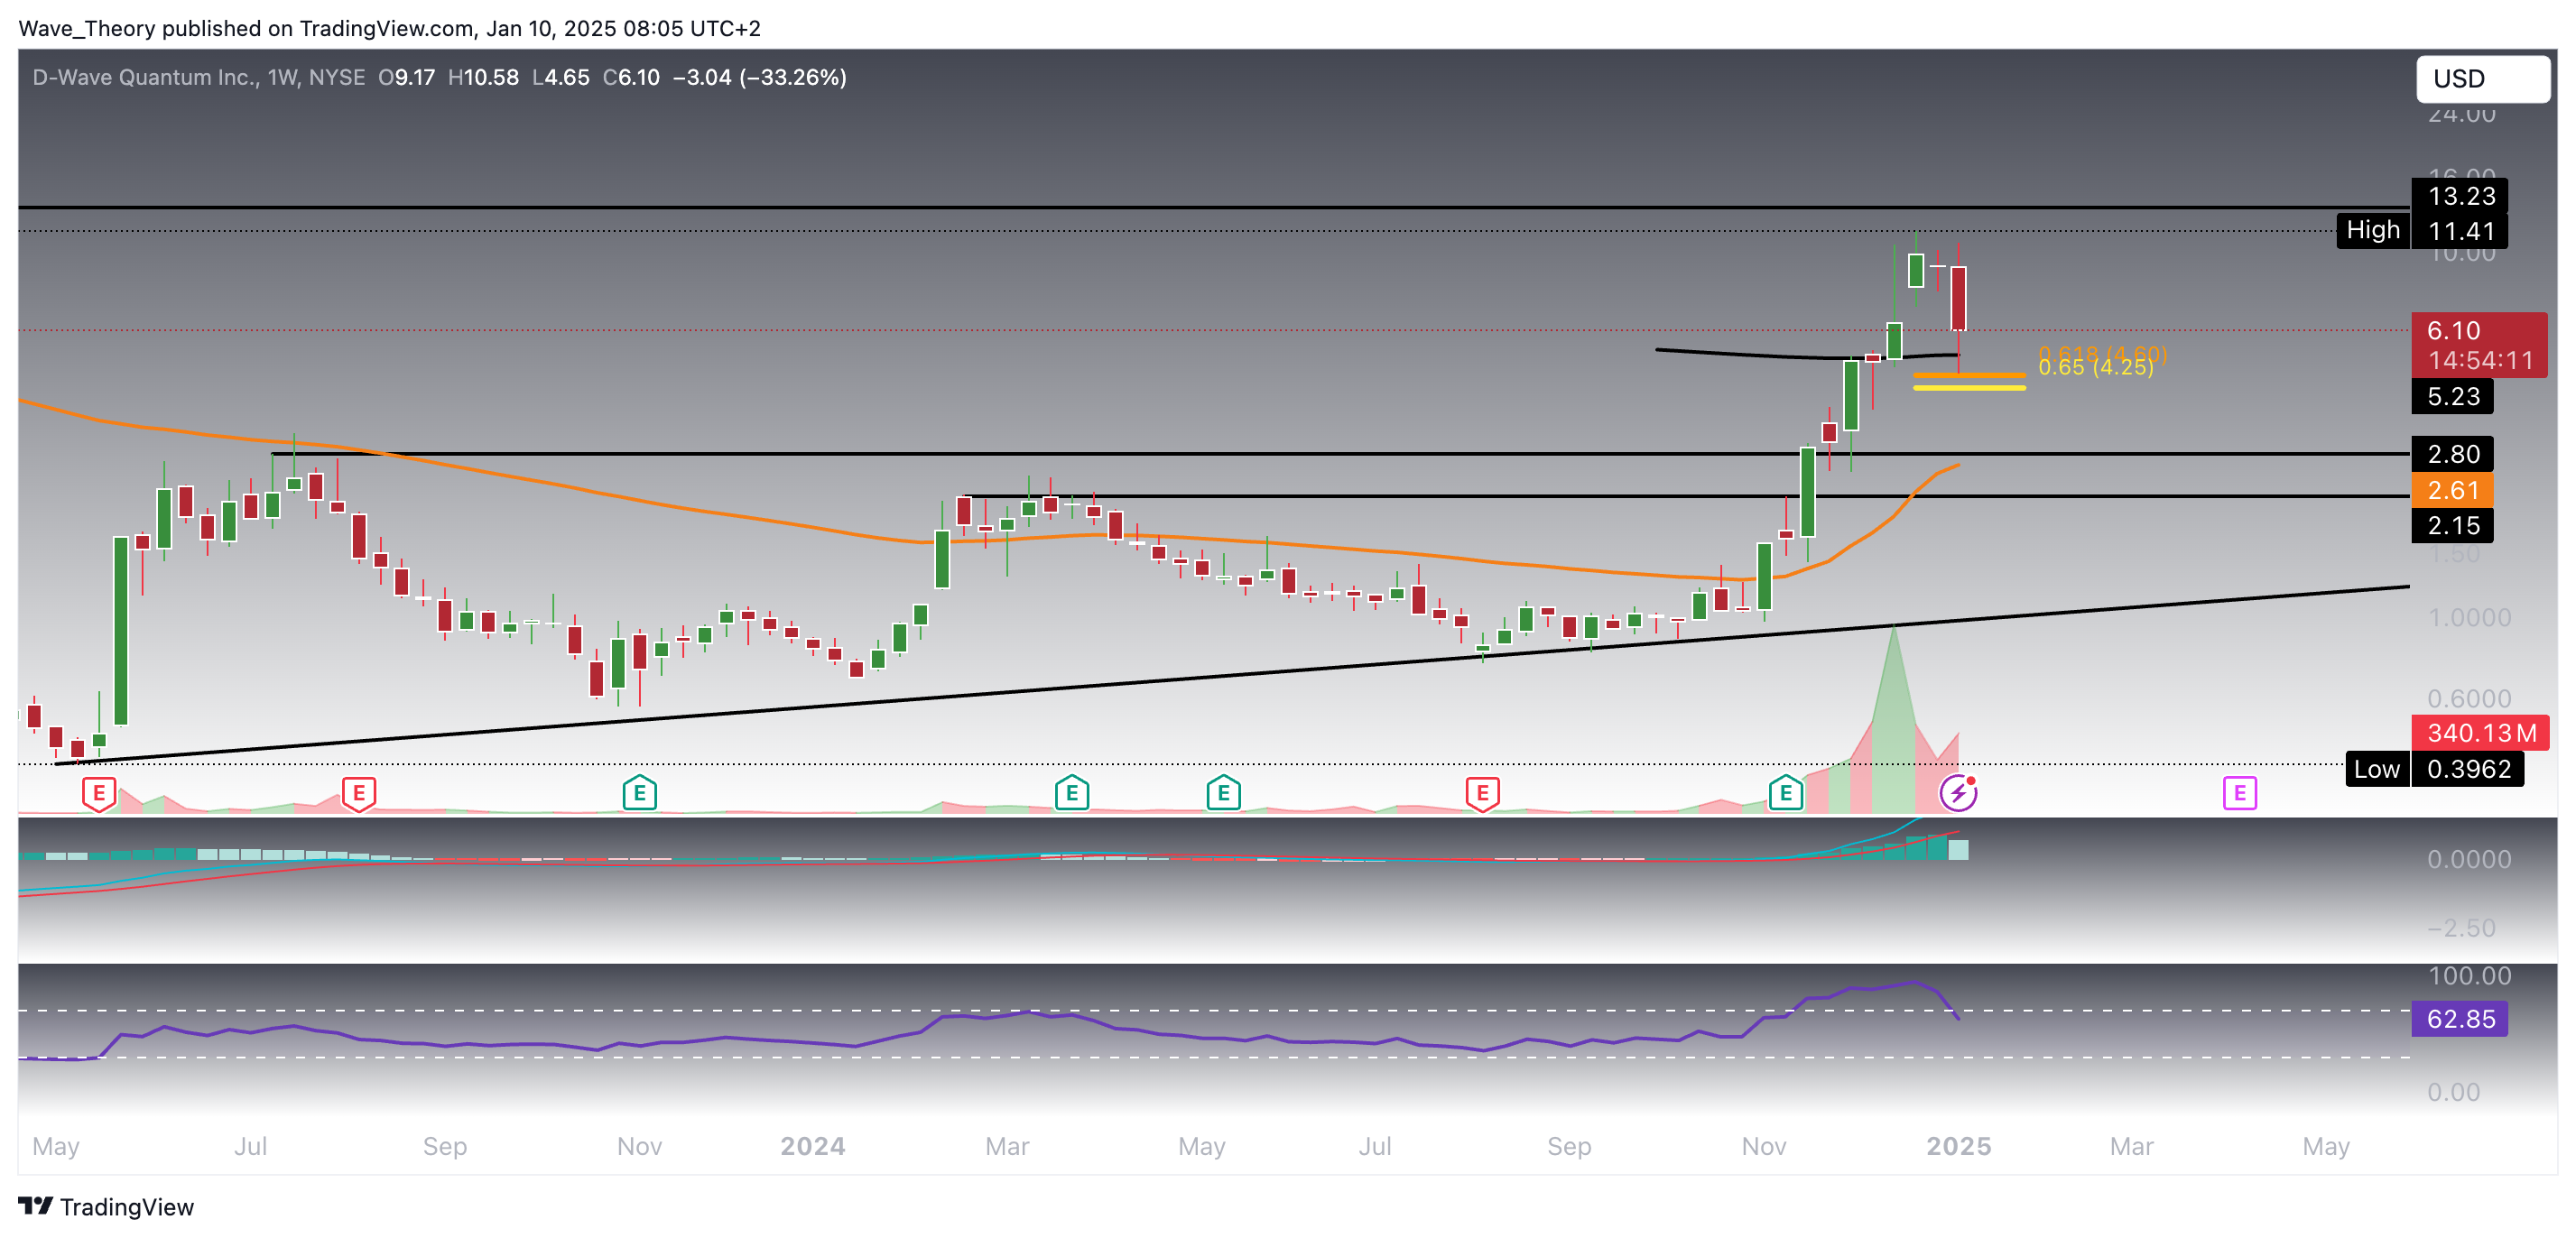
After a sharp correction over the past two weeks, QBTS has now found significant support at the golden ratio level at $4.5, a key technical zone that could potentially act as a strong foundation for a bullish reversal. From this level, the stock may look to rally towards the next resistance range between $11.4 and $13.2, where previous highs and market sentiment could limit further upside.
However, there are signs of caution. The MACD histogram has started to tick bearishly lower this week, suggesting a short-term loss of momentum. Despite this, the MACD lines remain bullishly crossed, indicating that the overall trend is still favorable for the bulls. Additionally, the RSI has entered neutral territory, offering no clear direction either way, which suggests indecision in the market. This mixed set of indicators implies that while a bounce is possible, the stock may face challenges as it navigates these key levels of support and resistance.
Mixed Signals On The Daily Chart
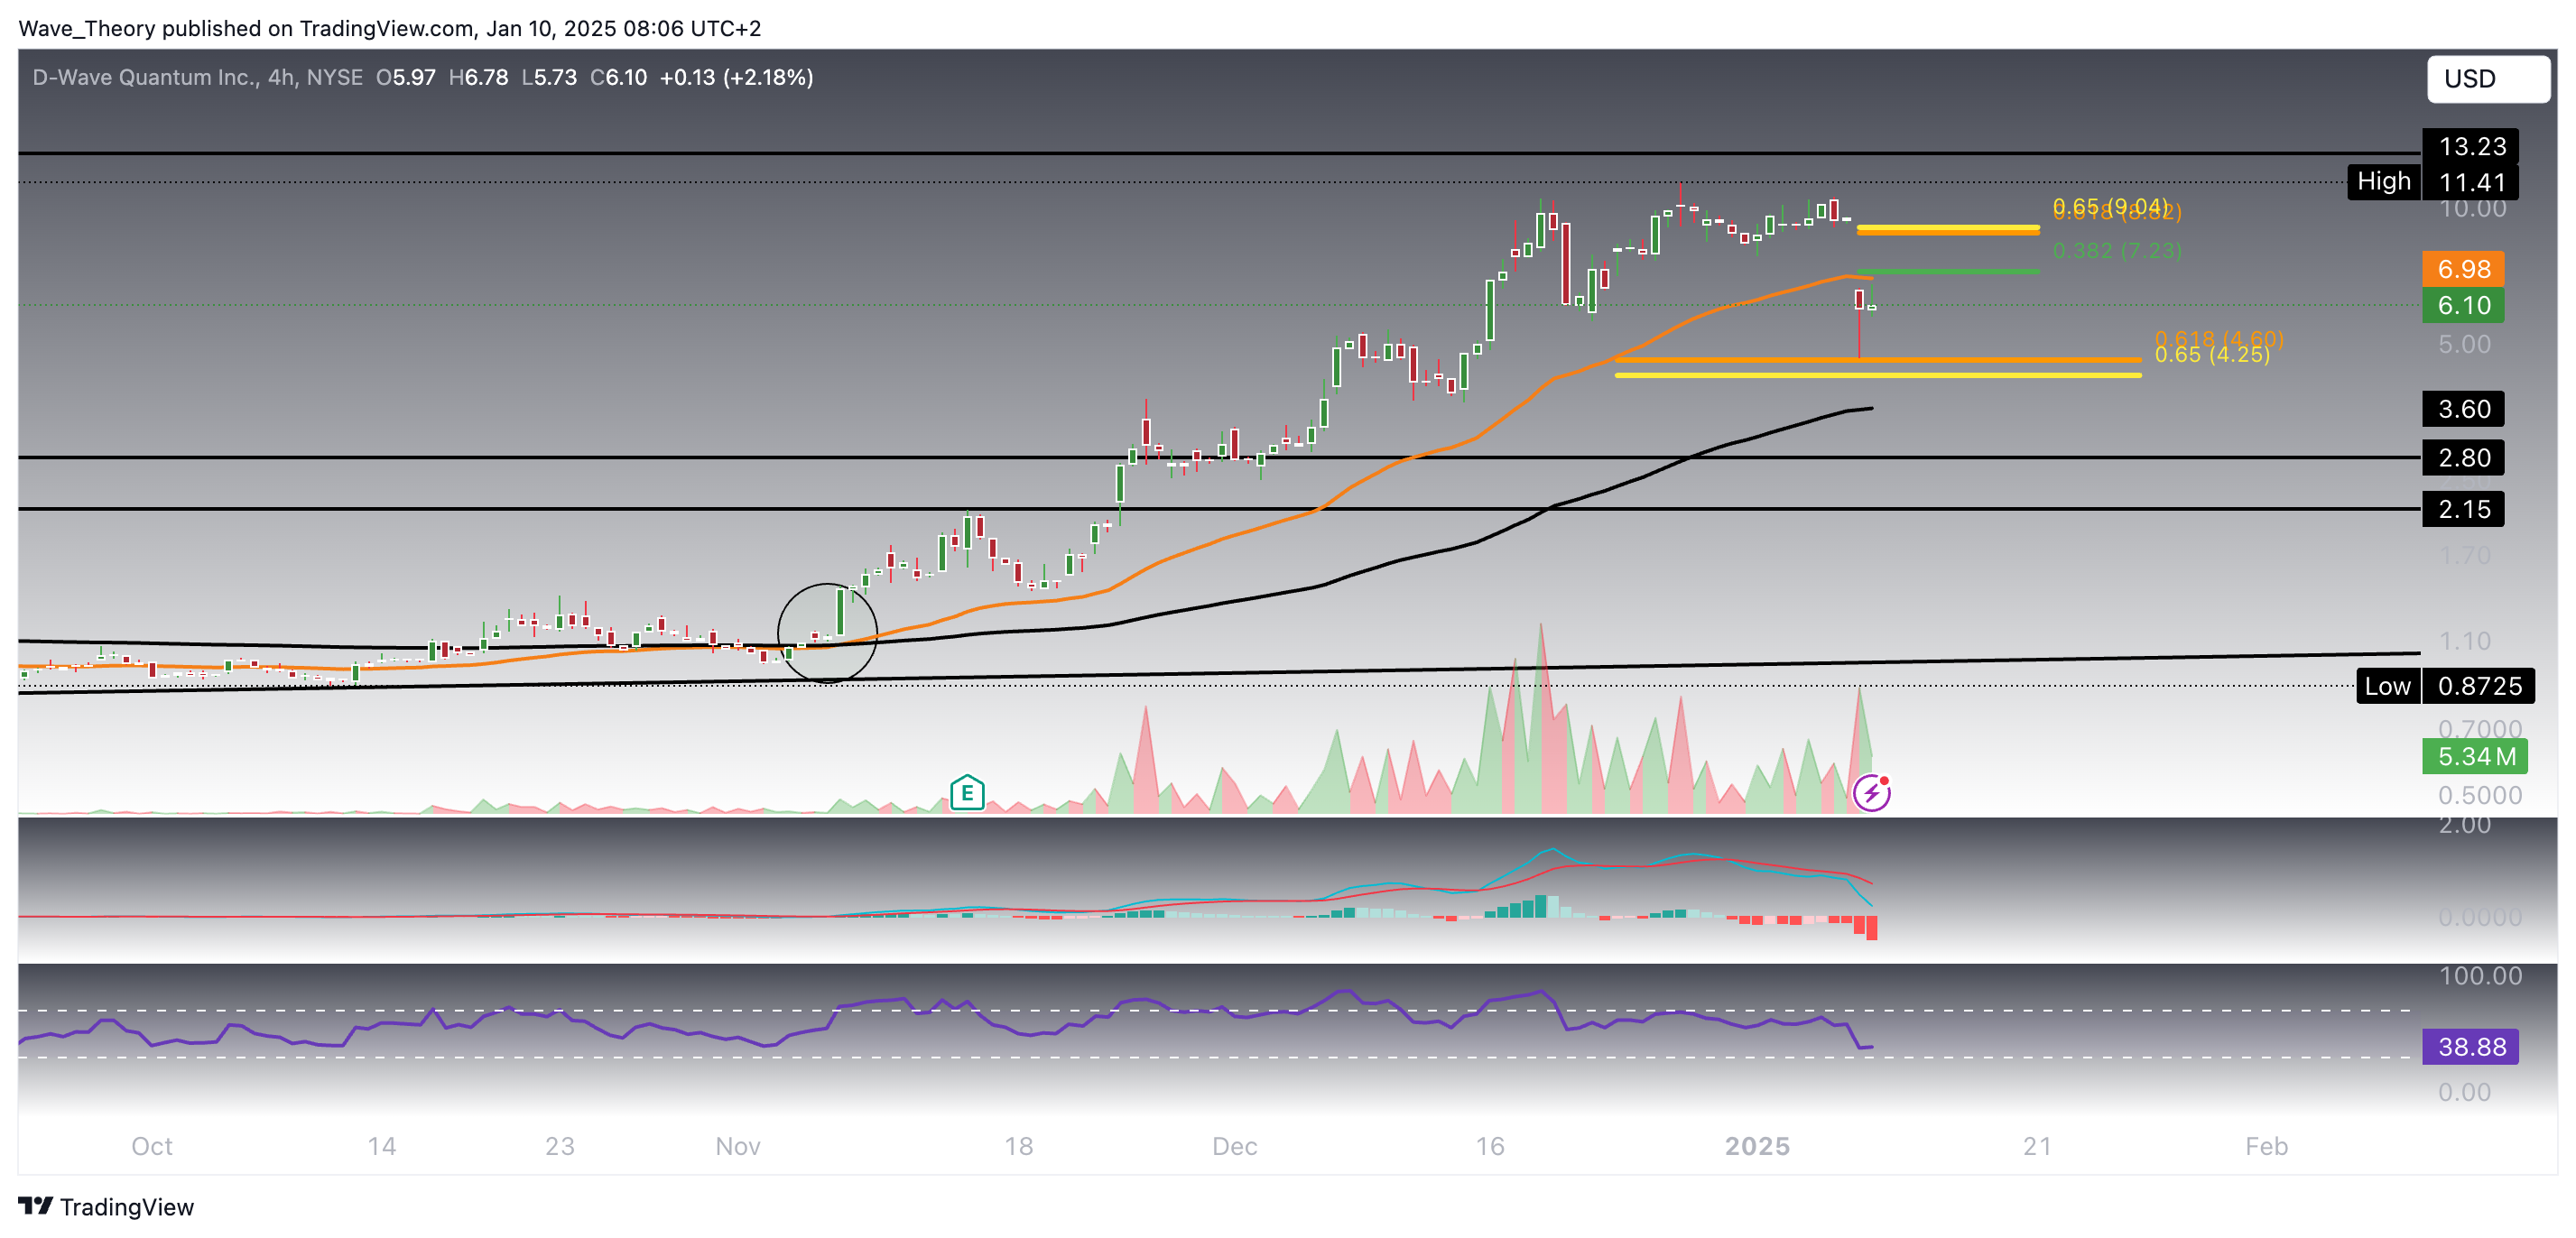
Similar Outlook For The QBTS Stock On The 4H Chart
On the 4H chart, the indicators present a similar mixed outlook. The bearish MACD and neutral RSI suggest a period of consolidation or potential weakness, while the bullish EMAs continue to confirm the short-term bullish trend, albeit with some cautionary signals.
QBTS is now facing its next significant Fibonacci resistance levels at $7.23 and $9, with the golden ratio at $9 serving as a critical level to break in order to invalidate the ongoing corrective movement. Should the stock fail to clear this resistance, it may face rejection, especially as the 50-4H-EMA also acts as resistance near the $7 level.
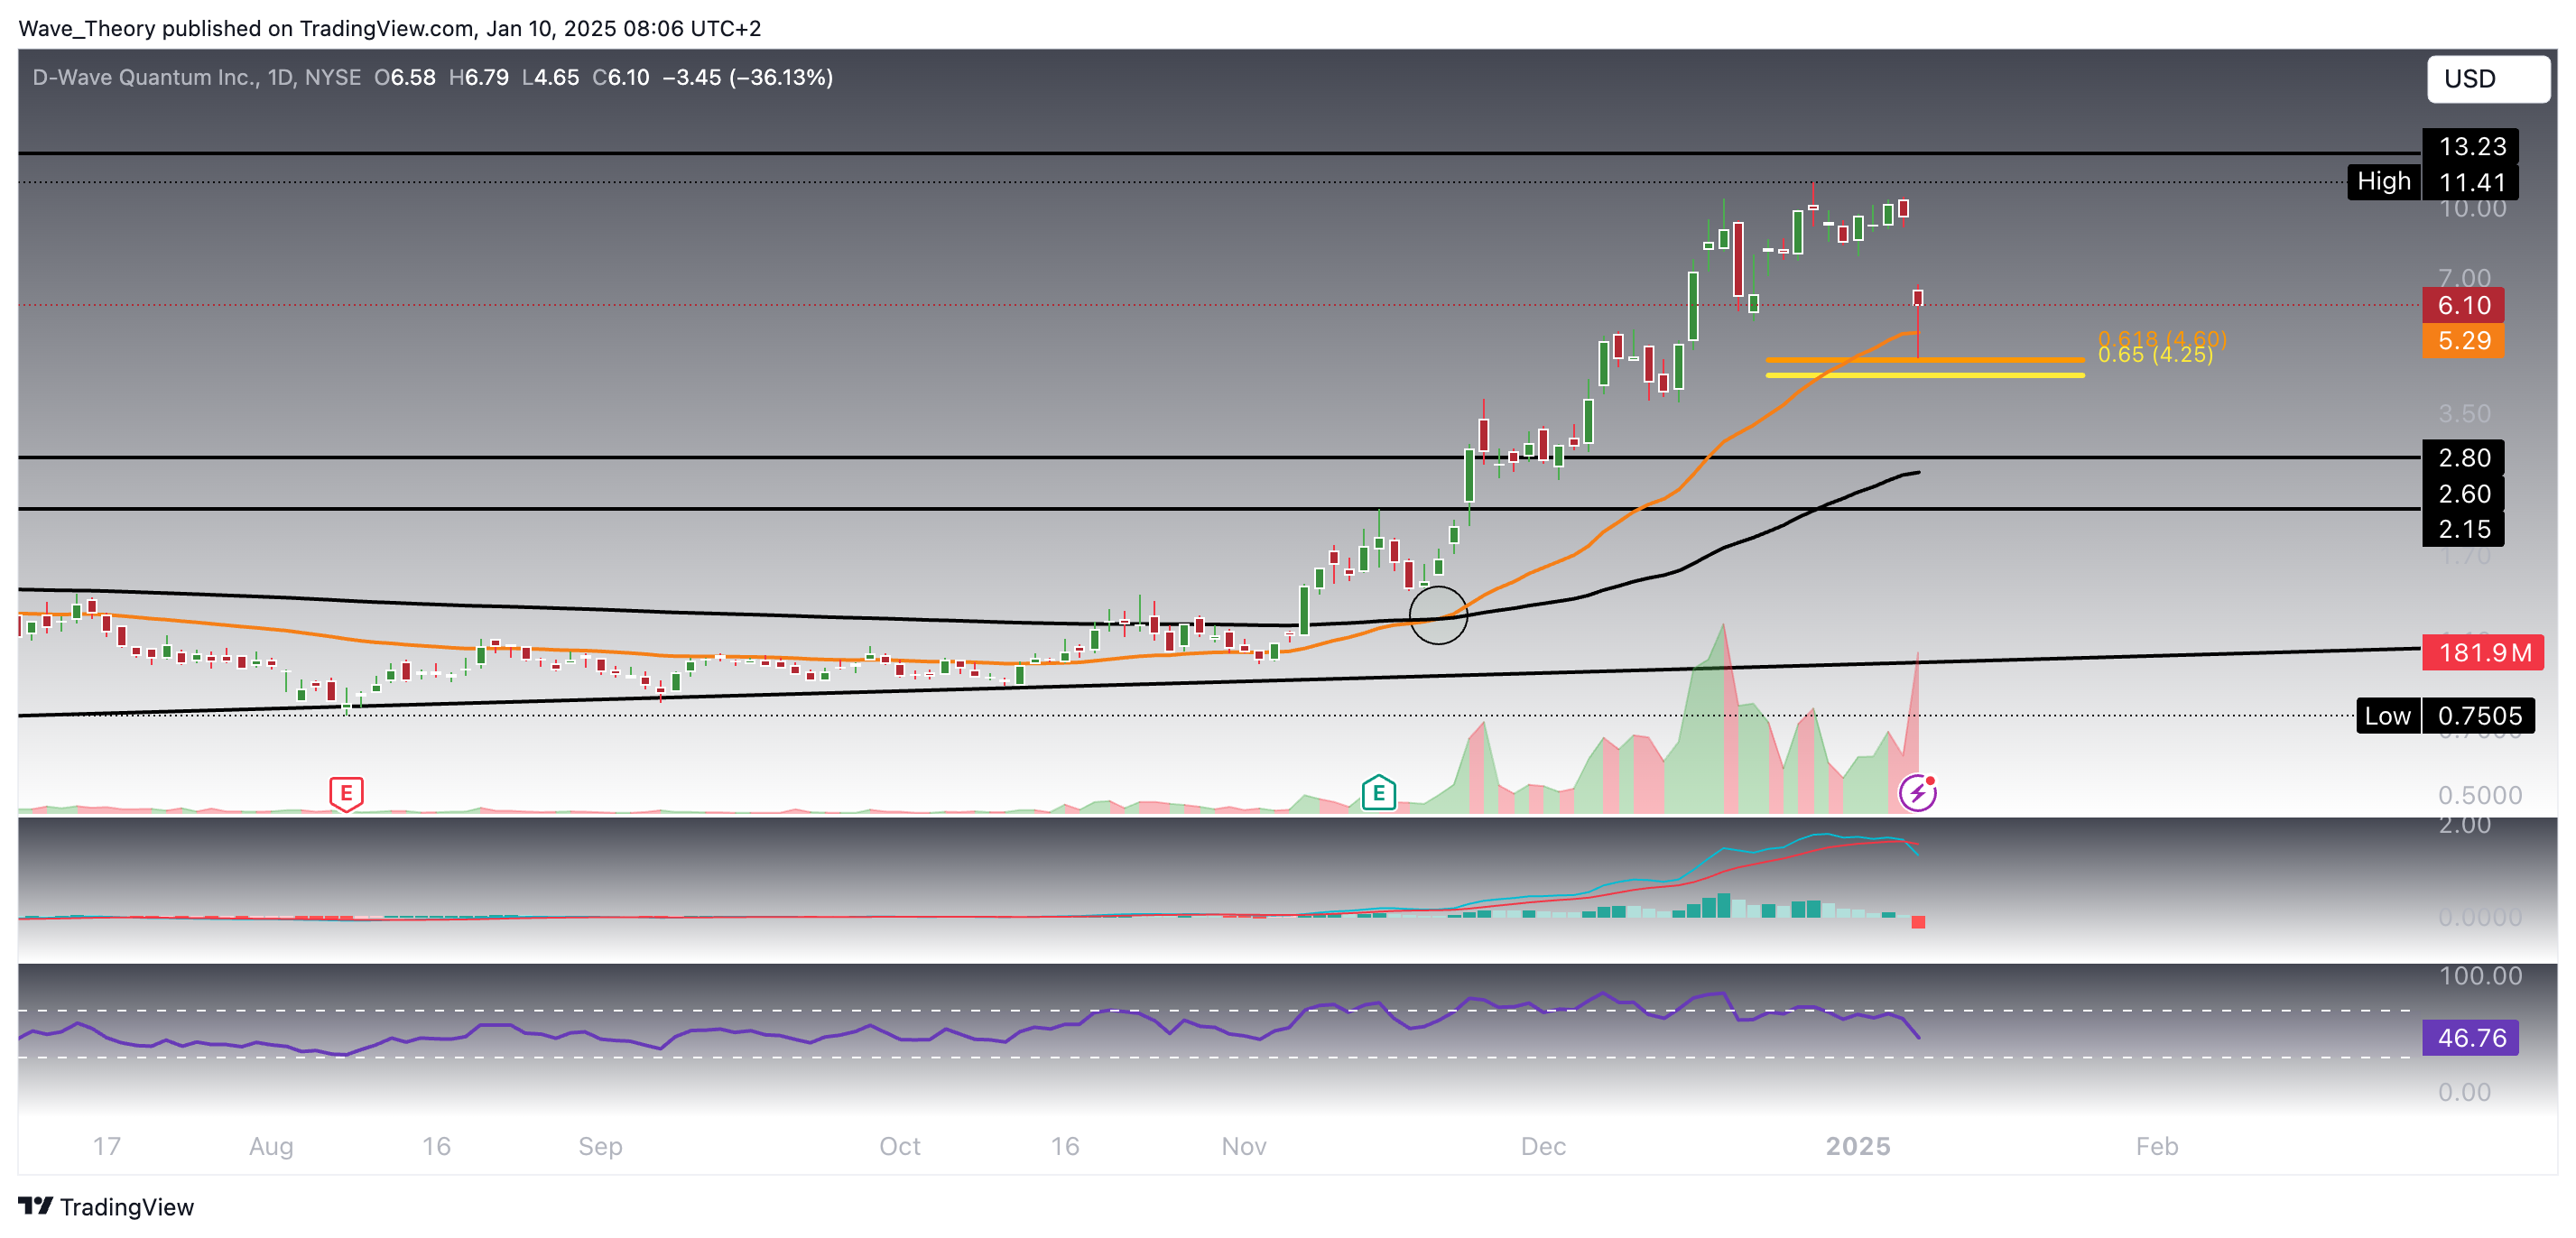
If QBTS breaks below the golden ratio support at $4.2, the next significant support zone is found between $2.15 and $2.8, where the stock could stabilize or face further downside pressure. These levels are crucial to watch for potential reversals or breakdowns in the price action.
- Check out our free forex signals
- Follow the top economic events on FX Leaders economic calendar
- Trade better, discover more Forex Trading Strategies
- Open a FREE Trading Account
- Read our latest reviews on: Avatrade, Exness, HFM and XM
Related Articles

Sidebar rates
Related Posts
