XRP Price Check: $2.50 – Trader’s Safe Zone or Sneaky Trap?
XRP has stabilized near the $2.50 mark, fluctuating between $2.48 and $2.52 in recent hours, with a market capitalization of $144 billion.
XRP has stabilized near the $2.50 mark, fluctuating between $2.48 and $2.52 in recent hours, with a market capitalization of $144 billion.

The cryptocurrency’s 24-hour trading volume stands at $7.57 billion, indicating healthy market activity. This micro-consolidation phase, following a brief peak at $2.60, suggests a period of equilibrium. Traders are now watching for clues on whether this support at $2.50 will hold or break.
On the hourly chart, resistance sits between $2.55 and $2.60, while support is firmly positioned at $2.45. Despite declining volume, the price action hints at a potential short-term correction rather than a bearish reversal. For traders, this presents opportunities to enter near the support zone with a target exit near $2.60 or $2.65.
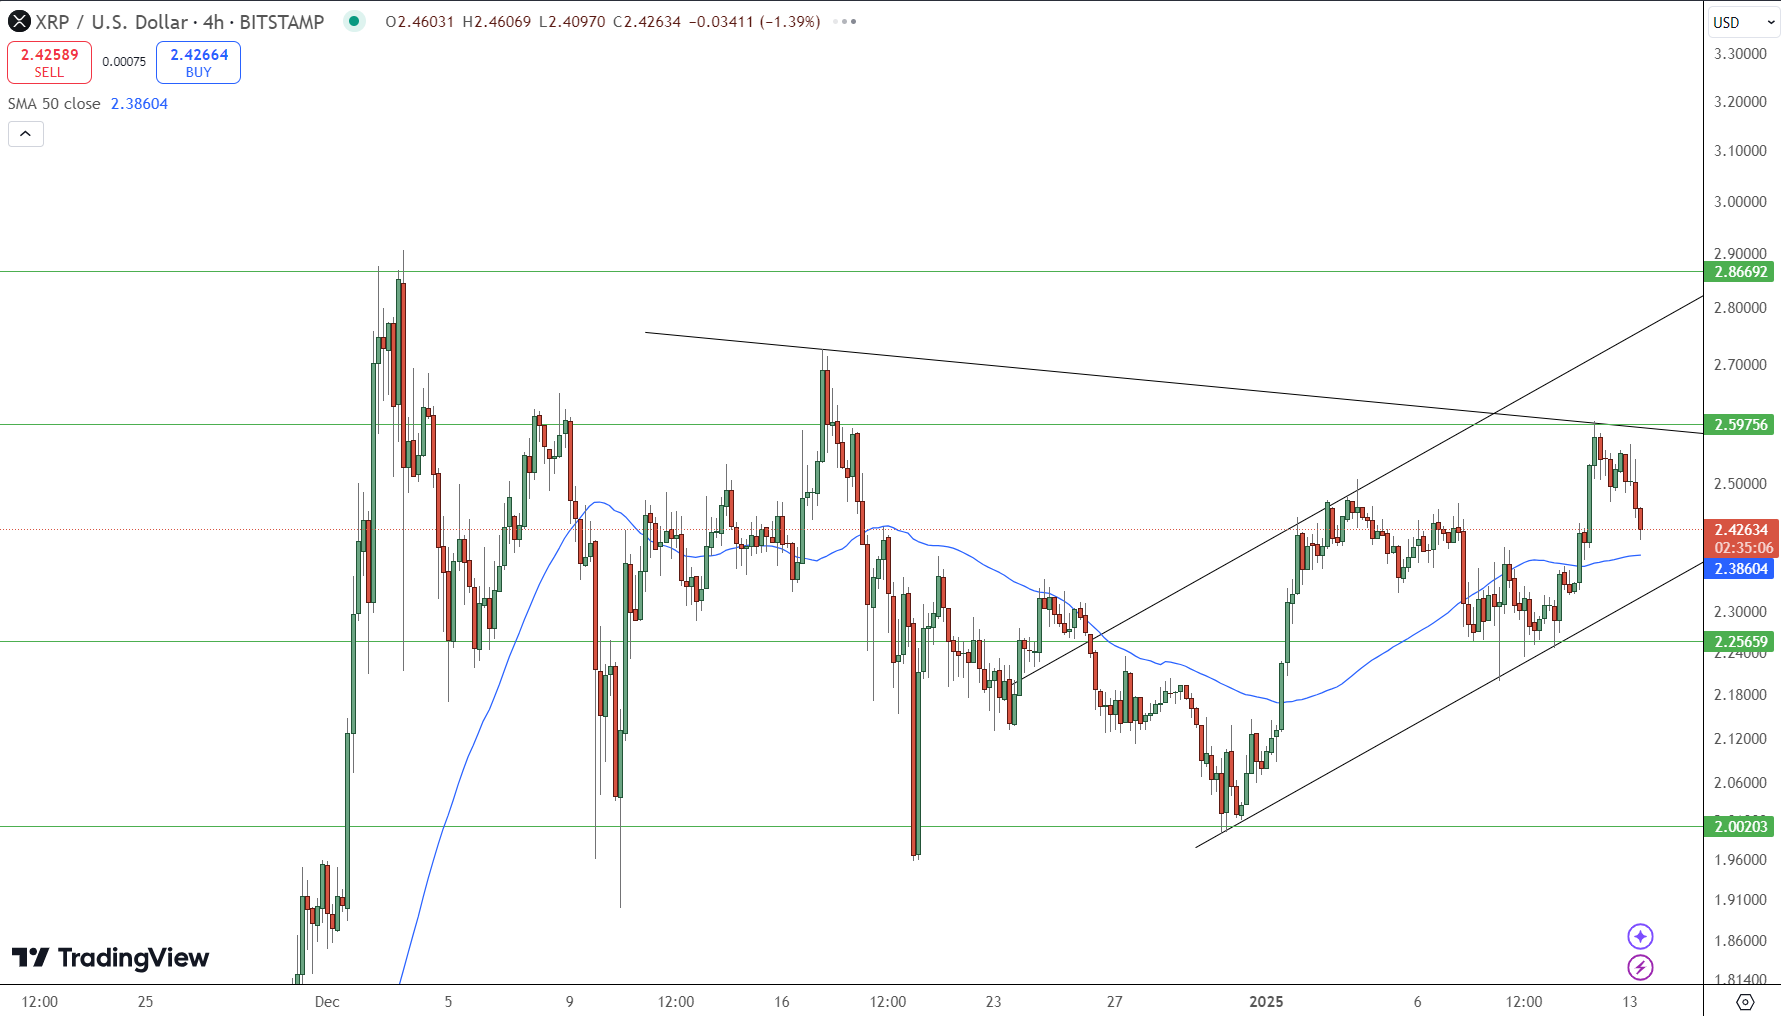
[[XRP-USD-graph]]
Key Resistance and Support Zones for Traders
Looking at the 4-hour chart, XRP continues its upward trajectory, maintaining stability at the $2.50 level after a solid rally earlier in the week. Resistance remains at $2.60 and $2.70, while support holds steady between $2.45 and $2.50. The current market sentiment appears bullish as long as XRP stays above these key levels.
Traders can consider two potential entry strategies:
-
Breakout Strategy: Enter on a confirmed breakout above $2.60, targeting the next resistance at $2.70.
-
Retracement Strategy: Enter on a pullback to $2.45, with an exit target between $2.60 and $2.70.
Long-Term Outlook: A Broader Recovery Pattern
On the daily chart, XRP shows a recovery pattern, rising from a recent low of $2.20 to a high of $2.72, before slightly retracing. This broader upward momentum is supported by increasing buying volume, indicating renewed market interest. Critical resistance remains at $2.72, with support zones forming around $2.40.
Key indicators for XRP’s near-term movement include:
-
Stochastic Oscillator: At 82.71, suggesting overbought conditions.
-
MACD: A positive signal of 0.07805, indicating potential upside.
Additionally, moving averages across the 10, 20, 50, 100, and 200-period timeframes remain bullish, reflecting favorable buy conditions. The alignment of these indicators signals that XRP is likely to continue its recovery as long as it stays above critical support levels.
Key Points:
-
$2.50 is a critical support level; the market consolidates here.
-
Resistance lies at $2.60-$2.70, with potential breakout opportunities.
-
Bullish trend is supported by positive moving averages and buying volume.
- Check out our free forex signals
- Follow the top economic events on FX Leaders economic calendar
- Trade better, discover more Forex Trading Strategies
- Open a FREE Trading Account
- Read our latest reviews on: Avatrade, Exness, HFM and XM
Related Articles


Sidebar rates
Related Posts
