FTSE Gets Some Reprieve Thanks to Lower Inflation – Bond Yields Soften
UK stocks recover from a 3-day decline thanks to lower-than-expected inflation. Gilt yields open lower on the day as bets on BoE cuts increa
Live FTSE Chart

UK stocks recover from a 3-day decline thanks to lower-than-expected inflation. Gilt yields open lower on the day as bets on BoE cuts increase.
- Inflation YoY rises by 2.5
- 10-year gilt yields decline to 4.819%
- Bets increase on BoE action
The FTSE rallied 0.52% this morning thanks to lower-than-expected inflation as the hopes for a possible rate cut.
UK Inflation Softens
Analysts had expected UK Inflation to be a touch higher than last month, the surprise was just what the FTSE needed to gain some momentum.
Forecasts were for a MoM rise in inflation of 0.4%, while the number released showed 0.3%. YoY inflation was forecast at 2.6% and came in at 2.5%.
Attention now turns to US inflation data later on this afternoon. The forecast is for YoY inflation to rise slightly to 2.9% from 2.7% last month.
While estimates for CPI expect a slight increase from 315.49 to 315.62. The market will be looking for signs of a slowdown in inflation, since recent remarks from Fed officials point to a slower pace of rate cuts.
FTSE Live Chart
Hurdles for the BoE
The BoE is facing various hurdles as it attempts to bring down interest rates to help a struggling economy. The pound is getting hammered and that could create imported price pressures given the UK’s large trade deficit.
At the same time the new budget is forecast to create larger borrowing needs and spark a rise in inflation.
The situation with possible Trump tariffs looming on the horizon only complicate matter further.
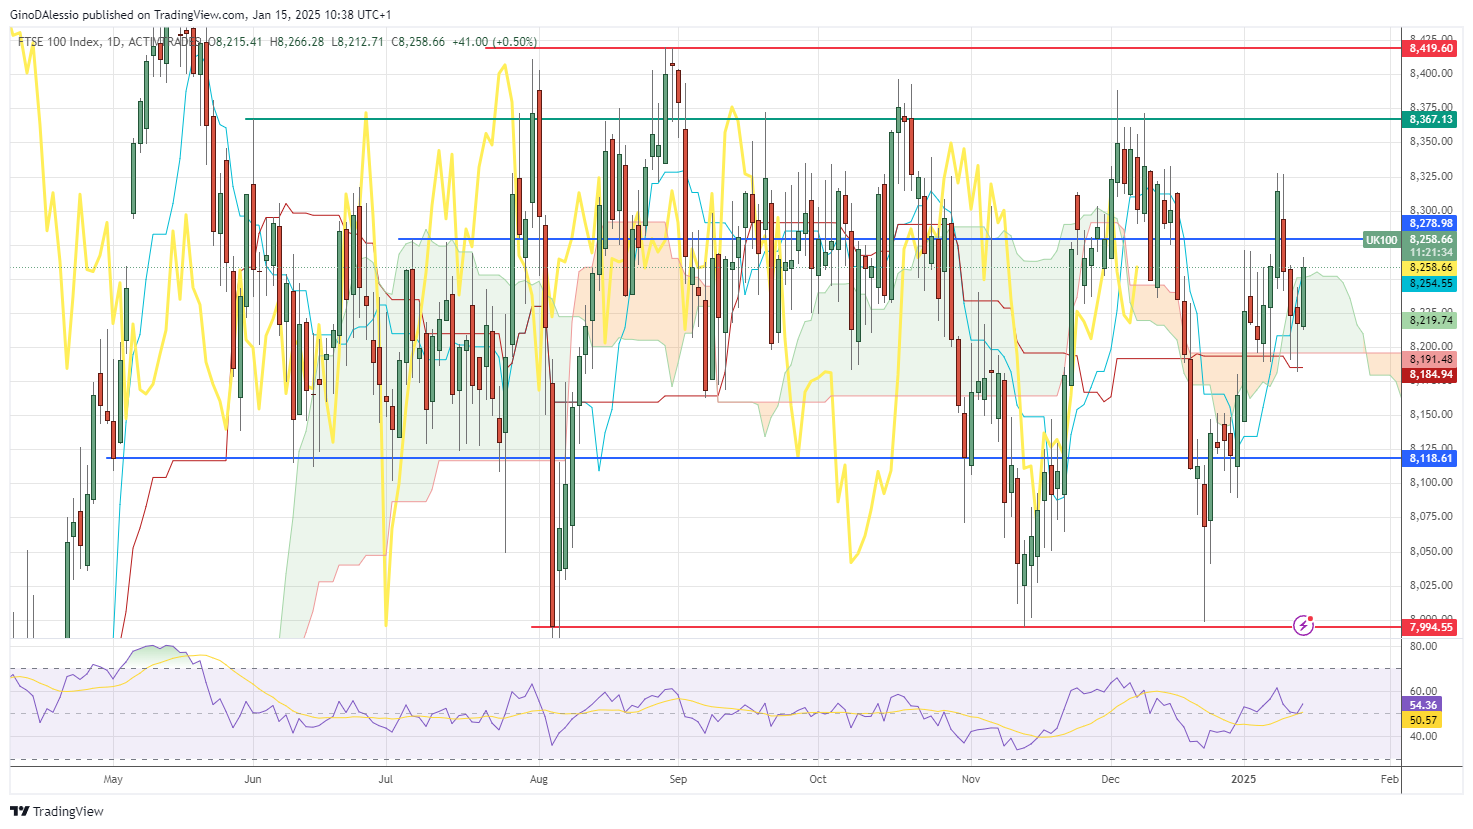
FTSE Technical View
The day chart above for the FTSE shows a market in a wide sideways trend, with no clear direction. Technically, you might consider the trend bullish, since the market is above the Ichimoku cloud.
However, the lack of direction is evident from the absence of a series of new highs or lows. Within the sideway range, I see initial support and resistance (blue lines) at 8,118 and 8,278 respectively.
Below and above those levels I see further support and resistance levels (red lines) at 7,994 and 8,419 respectively.
- Check out our free forex signals
- Follow the top economic events on FX Leaders economic calendar
- Trade better, discover more Forex Trading Strategies
- Open a FREE Trading Account
- Read our latest reviews on: Avatrade, Exness, HFM and XM
Related Articles


Sidebar rates
Related Posts
