S&P 500 Hits New All-Time High at 7,022 as US-Iran Diplomatic Hopes Fuel Risk-On Rally
The S&P 500 actually topped out at a new all-time high on Wednesday, April 15, 2026, - at a closing price of 7,022.95...
Quick overview
- The S&P 500 reached a new all-time high of 7,022.95 on April 15, 2026, marking a significant psychological milestone for investors.
- Investor optimism is fueled by hopes for a de-escalation of the US-Iran conflict, which has helped reduce safe-haven demand and supported risk appetite.
- Despite a mixed market breadth, major tech stocks have driven gains, with the Nasdaq Composite also hitting a new all-time high.
- Analysts caution that any breakdown in diplomacy or renewed geopolitical tensions could lead to increased market volatility.
The S&P 500 actually topped out at a new all-time high on Wednesday, April 15, 2026, – at a closing price of 7,022.95 – that’s up 0.80% (+55.57 points) on the day. And to make matters even more impressive, it also reached a fresh all-time high in intraday trading at 7,026.24.
Futures are looking pretty rosy early this morning, with modest gains of about 0.1% – and that optimism seems to be carrying over into Thursday’s session.
Wednesday’s Key Points of Interest
- The main index finally cracked the 7,000 level – that’s a big psychological milestone for many investors.
- It managed to erase all the losses it had racked up since the US-Iran conflict really started getting underway in late February/early March, and it’s now trading above its previous peak in January 2026.
- The Nasdaq Composite also notched a new all-time high on the day – and that’s its eleventh straight day of winning, believe it or not – with megacap tech stocks like Microsoft, Apple and some of the AI-related names really driving the charge, while the Dow Jones actually ended the session a bit lower.
- Breadth was a bit of a mixed bag – roughly half the constituents of the S&P 500 were in the red, which suggests there’s been a bit of concentration amongst the market’s biggest winners.
Today’s (April 16) Market Drivers & What’s Shaping the Market
The dominant theme of the day remains hopes for a de-escalation of the US-Iran conflict:
- Investors seem to be pricing in the possibility of a longer-term peace deal or a ceasefire extension – and that’s thanks to reports that there are renewed talks going on (possibly involving Islamabad) and some hints from President Trump that a resolution might be on the horizon.
- That’s helped reduce safe-haven demand, brought down oil prices a bit (even though they remain way up from where they were) and generally helped keep risk appetite going despite the ongoing naval blockade and chaos in the Strait of Hormuz.
- Markets are essentially kicking the can down the road on near-term geopolitical risks in favour of hoping for a return to some sort of normalcy and some seriously strong corporate fundamentals, especially in the tech and AI spaces.
Some other factors that are supporting the market right now include:
- US consumer spending is looking pretty resilient (which a bunch of major banks like Bank of America have picked up on).
- Expectations that corporate earnings will grow by double digits in 2026, despite all the worries about stagflation.
- A relatively soft US dollar and some easing in wholesale inflation readings (PPI) in the recent data.
But don’t get too comfortable just yet – any breakdown in diplomacy, a renewed escalation, or some persistent energy price pressures could all send volatility through the roof. The rally has got a bit of a short-covering and relief buying feel to it, and some analysts are saying it could run into resistance at these record levels.
S&P500 (SPX) Technical Outlook
The S&P 500 is now well and truly in price discovery territory above its previous highs.
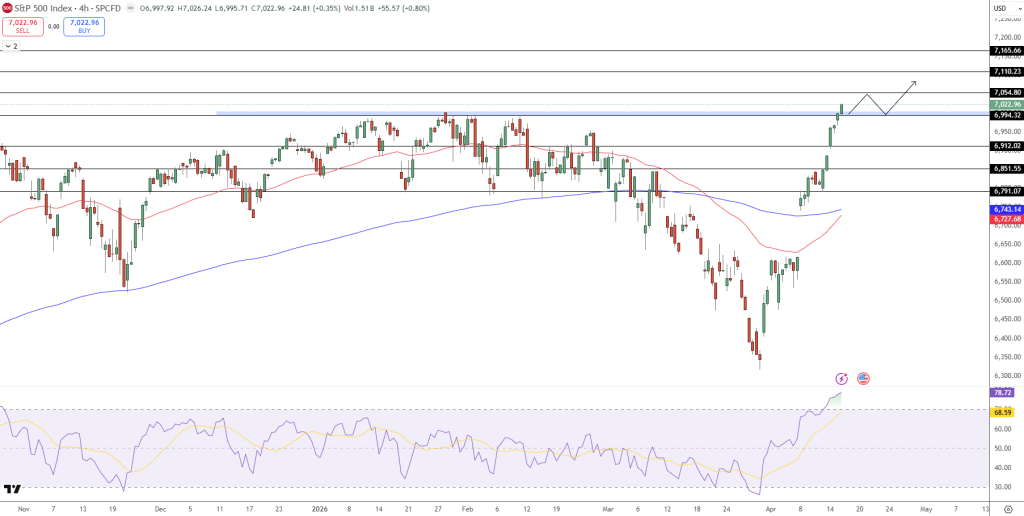
- Near-term support is probably going to be around the 6,967-6,978 zone (that’s its recent breakout area) and deeper still at the 50-day/200-day moving averages (which stayed above water even during the conflict dip).
- Resistance isn’t much of an issue right now, but psychological levels around 7,050-7,100 could start to attract some profit-taking.
- Volatility (VIX) has actually started to come down a bit, which reflects the improved mood in the market.
The Broader Context
- The recent trend has been a pretty sharp rebound from the March 30 lows (it’s up around 11% in some places) – and it’s fully recovered the Iran-war losses in just over two weeks. The index is actually now in the black for the year after getting off to a pretty rocky start.
- Sector rotation has seen tech and growth stocks leading the charge, while some cyclical and energy names have been doing a bit of a mixed bag – largely because they’re tied to oil prices.
- Longer-term outlook – many strategists are still pretty constructive because of the AI tailwinds and earnings momentum, though persistent conflict risks, potential stagflation and policy uncertainty (Fed, etc) could all cap upside. Some people are even eyeing further gains if we can get some kind of de-escalation that sticks.
Coming up, we’ve got a bunch of stuff on the horizon – like fresh US-Iran headlines, corporate earnings (for example, Netflix today), economic data and central bank signals. Markets are still basically headline-driven at this point.
- Check out our free forex signals
- Follow the top economic events on FX Leaders economic calendar
- Trade better, discover more Forex Trading Strategies
- Open a FREE Trading Account
- Read our latest reviews on: Avatrade, Exness, HFM and XM
Related Articles


Sidebar rates
Related Posts
