BE Stock’s +1,262% Gain: Bloom Energy’s Rocket Run Hits Turbulence, Is This a Dip or a Top?
Bloom Energy (BE) stock slumps 6.25% after a 1,262% 12-month surge. Here's what the charts, fundamentals, and smart money say now.
Quick overview
- Bloom Energy's stock closed at $258.71 on May 18, down 6.25%, but has risen over 1,262% in the past year.
- The recent sell-off is attributed to profit-taking, sector rotation, and insider sales, rather than company-specific issues.
- Bloom Energy's strong Q1 results and raised fiscal-year guidance indicate robust growth potential, despite current market volatility.
- Analysts have mixed views on the stock's valuation, with a consensus price target significantly lower than current trading levels.
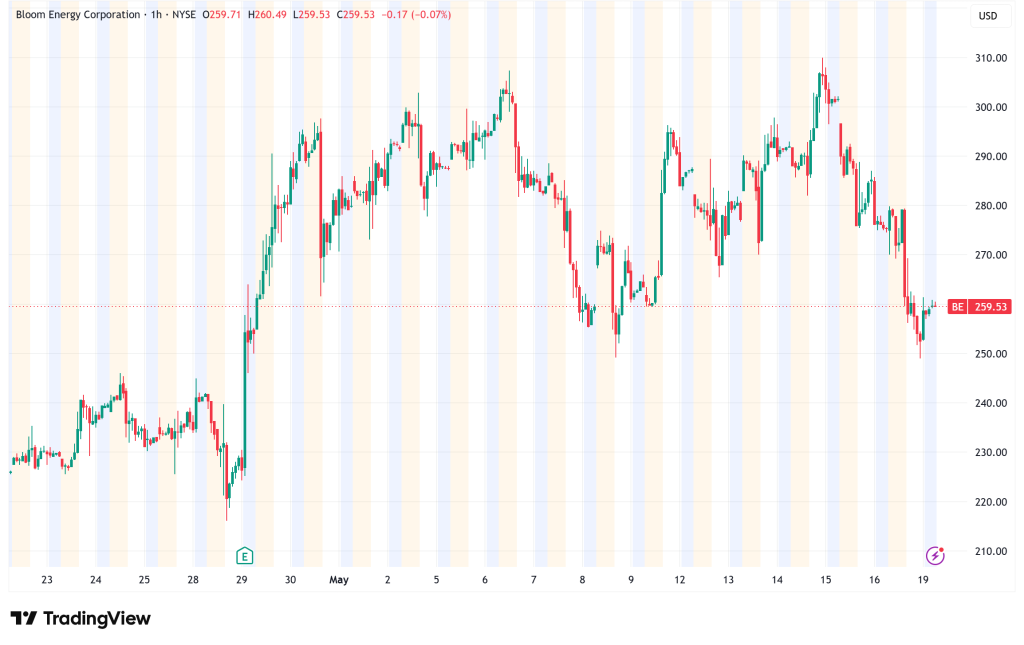
Bloom Energy (NYSE: BE) closed at $258.71 on May 18 — down $17.24, or 6.25%, in a single session. That sounds alarming. But zoom out, and you see a stock that has risen over 1,262% in the past 12 months. Monday’s drop is the market catching its breath, not necessarily signaling a collapse.
The stock hit an all-time high of $310 on May 14. It has since shed roughly 17% from that peak. The question now: is this a healthy pullback in a powerful uptrend — or the start of something more painful?
Key Reasons Behind Bloom Energy Stock Sell-Off
The pullback follows a period where the stock surged after a first-quarter double beat and higher fiscal-year 2026 guidance — but traders are now fading momentum as the move gets extended and the tape turns more selective.
There’s no single smoking gun. Three forces are at work:
- Profit-taking. After a near-vertical run, short-term traders are locking in gains.
- Sector rotation. BE was mentioned in a broader market roundup as AI and clean-energy names sold off, suggesting the stock is being pulled down by sector-wide volatility rather than company-specific news alone.
- Insider sales. Insider Aman Joshi sold 4,813 shares on May 14 at an average price of $288.20, worth about $1.39 million. The filing says the sale was made to cover tax withholding tied to vested equity awards.
BE’s Q1 Numbers That Started the Rally
The fundamentals behind the surge are real. Bloom didn’t just beat estimates — it demolished them.
- Adjusted EPS: $0.44 vs. $0.13 expected — a 238% beat
- Revenue: $751.05M vs. $551.55M expected — a 36% beat
- Revenue growth: +130.4% year-over-year
- Product revenue: up 208%
- Operating cash flow: $73.6M, up $184.3M vs. the prior-year period
Bloom Energy raised its FY 2026 guidance, now forecasting adjusted EPS in the range of $1.85 to $2.25, up from $1.33 to $1.48 previously. It also raised its revenue target from $3.1B–$3.3B to $3.4B–$3.8B — indicating robust YoY growth of roughly 80% at the midpoint.
CEO KR Sridhar called Bloom the “go-to choice” for on-site power. The market agreed — briefly.
BE Stock Technical Analysis: What the Chart Is Saying
The trend structure remains bullish. But momentum is cooling fast.
Key Moving Averages Still Stacked Bullishly
- 20-day SMA: ~$264 (stock is just below this line)
- 50-day SMA: ~$199 — BE trades 32% above it
- 200-day SMA: ~$127 — BE trades 108% above it
That moving-average stack (20-day above 50-day, and the 50-day above the 200-day) keeps the bigger-picture structure bullish, even as the stock digests gains.
MACD Flashes Warning
MACD is below its signal line and the histogram is negative, which typically means upside pressure is cooling. When MACD sits below its signal line, the trend can stay up, but the push behind it is weakening.
RSI in Overbought Territory
RSI entered overbought territory in May, which often precedes either sideways “digestion” or a sharper mean-reversion move back toward faster moving averages. The stock needs to either cool off or attract fresh buyers quickly.
BE Key Levels to Watch
- Resistance: $303 — near the 52-week high zone; rallies may stall here
- Support: $249 — a prior demand zone; breach here could accelerate selling
- Critical floor: $199 (50-day SMA) — losing this would damage the bull case
How Will Bloom Energy Stock (BE) Trade in the Near-Term?
- Bull case: Buyers step in at $249 support, MACD crosses back positive, stock pushes toward $280–$303.
- Base case: Sideways consolidation between $249 and $280 as the stock digests its gains over 2–4 weeks.
- Bear case: Break below $249 triggers a slide toward the 50-day SMA near $199 — a ~23% drop from current levels.
Bloom Energy’s AI Power Angle: Institutional Investors Buy BE
Bloom isn’t just a clean energy play anymore. It has become an AI infrastructure bet.
Polen Capital stated that AI data centers require an enormous amount of power, and one of the key challenges has been the inability of power grids to supply the necessary electricity to meet the constant and growing demands from AI workloads. Bloom’s Energy Server fuel cells help address this issue, generating cost-efficient, reliable power onsite.
The order flow backs this up:
- Oracle & BorderPlex plan to run Project Jupiter, a New Mexico AI data center, entirely on Bloom fuel cells, with capacity of up to 2.45 gigawatts.
- Federal Pacific last week reported a major new deal with Bloom Energy, landing the company’s largest-ever single order to supply medium-voltage switchgear and engineering services for an AI data-center job.
- American Electric Power announced a unit plans to buy about $2.65 billion in solid oxide fuel cells to back a fuel-cell generation facility.
Institutions are following the orders. Mitsubishi UFJ Asset Management boosted its position by 286.5% to 224,934 shares, now valued at about $19.5 million. Donoghue Forlines LLC bought 22,627 shares worth roughly $2.0 million.
Analysts Divided on Bloom Energy (BE) Stock Valuation
Wall Street broadly likes the story, but price targets vary wildly.
Morgan Stanley restated an “overweight” rating with a $310 price target. Royal Bank of Canada raised its target to $335 with an “outperform” rating. JPMorgan raised its target to $267 with an “overweight” rating.
The consensus rating stands at “Moderate Buy” with a consensus price target of $217.48 — well below current prices, reflecting significant valuation disagreement.
Barclays’ Christine Cho sits at equal-weight with a $254 target. The stock is trading above most analyst targets. That gap matters.
Bulls argue:
- Revenue doubling. Guidance raised sharply.
- Real, named customers placing real, gigawatt-scale orders.
- AI power demand isn’t slowing — it’s accelerating.
- Institutional money is still flowing in.
Bears argue:
- The market is pricing in a lot of optimism, which can make shares more sensitive when sentiment cools.
- The P/E ratio is deeply negative — the company is not yet consistently profitable at scale.
- Bloom flagged big upfront costs, the need for financing, debt, delays in installation, supply limits, tariffs, and the risk that AI data-center uptake could cool.
- The stock has a beta of 3.52 — meaning it moves roughly 3.5x the market. Volatility cuts both ways.
Why Bloom Energy is a High Conviction, High Risk Stock to Trade
Bloom Energy has a genuinely transformative product at the right moment in history. The Q1 results were not a fluke — they reflected real demand from real customers for a real power solution that utilities can’t match on speed.
But the stock has run far ahead of most analyst targets and is digesting a parabolic move. The next question is whether Bloom can convert Oracle demand, Federal Pacific supply contracts, and utility orders into real shipments, better cash flow, and margins strong enough to back a stock that’s running above a lot of analyst targets.
For long-term investors: $249 is the line to watch. Hold above it, and the bull case stays intact. Lose it, and the 50-day near $199 becomes the next test.
For traders: MACD and RSI suggest the easy money has already been made. Patience here — let the tape prove new buyers are in control before chasing.
- Check out our free forex signals
- Follow the top economic events on FX Leaders economic calendar
- Trade better, discover more Forex Trading Strategies
- Open a FREE Trading Account
- Read our latest reviews on: Avatrade, Exness, HFM and XM
Related Articles

Sidebar rates
Related Posts
