Sasol Share Price Attempts to Resume Uptrend in June as Oil Bounce Offers Relief
Sasol’s recent volatility reflects shifting crude oil prices, growing analyst caution, and structural energy-sector challenges, even as brief oil-driven rebounds provide temporary support.
Quick overview
- Sasol's stock has experienced significant volatility due to fluctuating crude oil prices and growing analyst caution.
- Despite a recent rebound in oil prices providing temporary relief, investor confidence remains low amid ongoing geopolitical uncertainties.
- Analysts have downgraded their outlook on Sasol, with only two out of nine maintaining a buy rating, reflecting concerns over limited upside potential.
- The company faces structural challenges related to its carbon-intensive operations and declining gas feedstocks, impacting its long-term competitiveness.
Sasol’s recent volatility reflects shifting crude oil prices, growing analyst caution, and structural energy-sector challenges, even as brief oil-driven rebounds provide temporary support.
Oil Volatility Triggers Sharp Moves in Sasol
Shares of Sasol Limited came under renewed pressure last week as fluctuations in global crude oil prices drove sentiment swings across the energy sector.
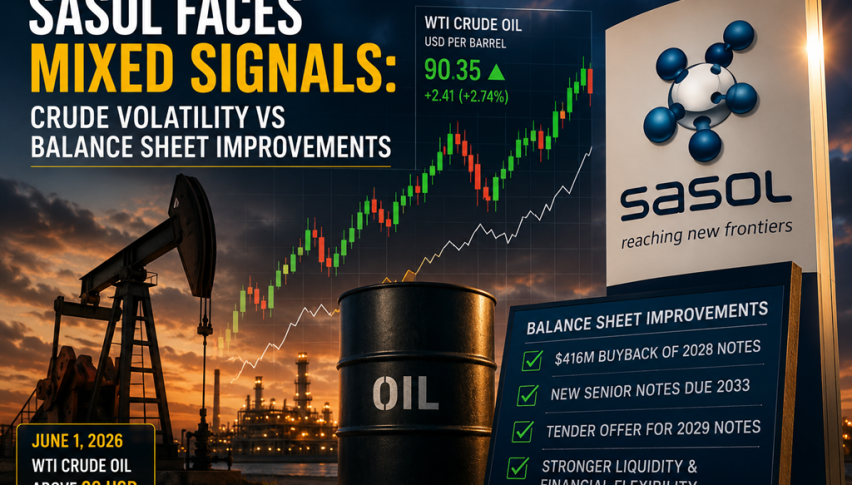
After a strong year-long rally that saw the stock more than double, momentum reversed sharply when crude oil retreated on optimism around potential US–Iran negotiations. West Texas Intermediate (WTI) briefly slipped below the key $90 per barrel level, triggering profit-taking and renewed selling pressure in oil-linked equities.
Sasol shares weakened alongside the broader energy complex, with the stock testing important technical support levels and at one point approaching the psychologically significant R200 mark.
Oil Rebound Provides Short-Term Relief
Sentiment improved on June 1 when WTI crude prices rebounded back above $90 per barrel, helping lift energy-linked stocks, including Sasol. The recovery offered temporary relief after several sessions of volatility-driven selling.
However, the rebound has not yet fully restored confidence, as investors remain cautious about whether oil prices can sustain higher levels amid ongoing geopolitical negotiations and demand uncertainty.
Analysts Turn More Cautious on Upside Potential
Despite earlier optimism linked to higher oil prices and balance sheet improvements, analyst sentiment toward Sasol has become increasingly cautious.
Out of nine analyst ratings, only two now remain at buy, marking the weakest level of bullish positioning since 2019. Recent downgrades from Nedbank Group and Citigroup have reinforced concerns that upside may be limited from current levels.
Nedbank analyst Thobela Bixa notably downgraded Sasol to underweight, arguing that recent gains driven by elevated oil prices may not be sustainable over the medium term.
Structural Challenges Continue to Weigh on Outlook
Beyond short-term price movements, Sasol continues to face deeper structural headwinds.
The company remains exposed to carbon-intensive operations tied to coal-to-liquids production, raising long-term environmental and regulatory risks. At the same time, declining gas feedstocks from Mozambique add uncertainty around future production stability and input costs.
While management continues to invest in energy security initiatives and sustainability-related improvements, investor focus remains anchored on profitability pressures, emissions exposure, and longer-term competitiveness in a transitioning energy landscape.
Trying to Resume Uptrend After for 2 Months
Shares of Sasol staged a notable recovery in 2026 after pulling back to the R200 level on the JSE. That support zone attracted buyers, triggering a sharp rebound but buyers have been unable to push higher in the last 2 months. Sentiment remains cautious, with traders still mindful of ongoing volatility and mixed forecasts across the energy market.
SOLJ Chart Daily – Will the 50 SMA Act as Resistance
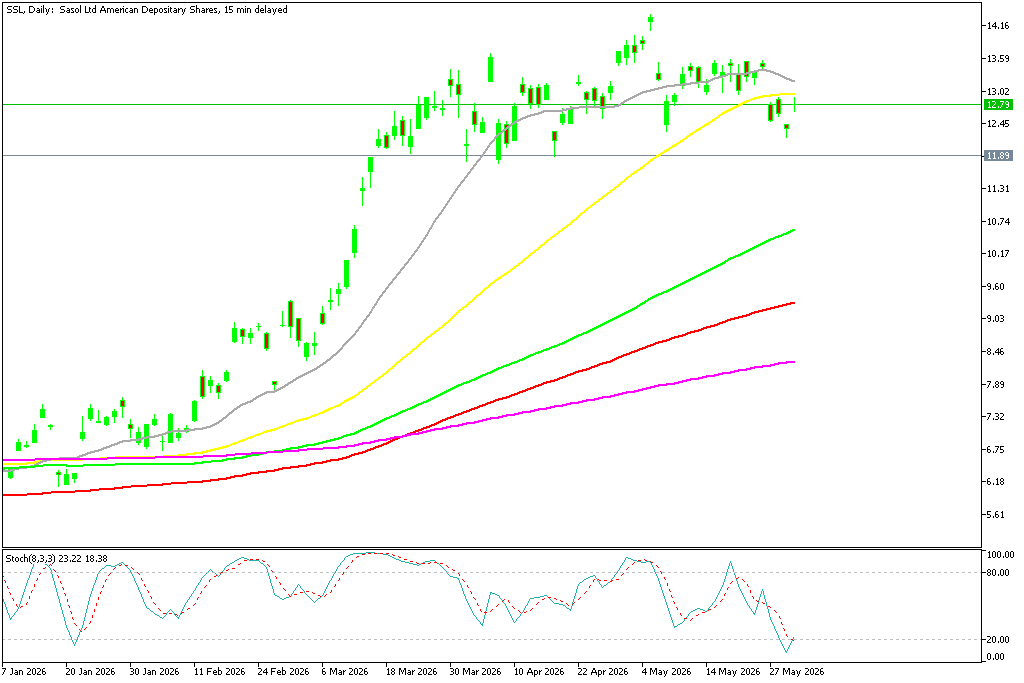
While now the R200 has turned into support, where the 20 daily SMA (gray) stands, supporting the uptrend further.
Technical Levels Come Back Into Focus
From a technical standpoint, Sasol’s chart suggests a trend reversal in 2026 after being bearish since 2022. In August, the stock successfully reclaimed its 50-week simple moving average (yellow), reigniting buying interest and confirming a medium-term trend shift.
That level, currently around R100, has since acted as a key support zone and it held strong despite the temporary piercing below it.
SOLJ Chart Weekly – The 200 SMA Has Turned Into Support

The 100-week moving average (green) which rejected the bounces higher twice was broken in February and last week the 200 weekly SMA (purple) was broken too as buyers pushed the price above R200 level and seems like the 200 SMA has turned into support now, reinforcing the upside bias.
SOLJ Chart Monthly – Failing at the 100 SMA Resistance

On the monthly chart above the 20 SMA (gray) was acting as a resistance indicator, which rejected the price but we saw a clear break last month and turned into support. In March, buyers broke the 50 monthly SMA (yellow) but they failed to break above the 100 SMA (green) which rejected the price and SOLJ shares are reversing lower now.
Balance Sheet Improvements Support Stability
Despite market caution, Sasol has taken meaningful steps to strengthen its financial position.
Recent actions include a $416 million buyback of 2028 notes, issuance of new senior notes due 2033, and a tender offer for 2029 bonds. These measures reflect a disciplined refinancing strategy aimed at improving liquidity and extending debt maturity profiles.
This proactive approach has helped reduce near-term financial risk and provided some support to investor sentiment during periods of commodity volatility.
Earnings Show Sensitivity to Oil Cycle
Recent financial results highlight the company’s continued sensitivity to crude oil price movements.
Net income for the six months to December 2025 fell sharply to R241 million from R4.6 billion a year earlier, reflecting weaker oil prices and operational disruptions, including a R3 billion impairment charge.
However, positive free cash flow generation and reduced capital expenditure have helped stabilize the underlying financial position, offering some resilience despite cyclical earnings pressure.
Sasol 2025 Earnings Report
📊 Financial Performance
Adjusted EBITDA:
- Declined 12% YoY to R21 billion
- Impacted by weaker commodity prices and a stronger rand
Cost Discipline:
- Cash fixed costs down 2% to R34 billion
- Capital expenditure reduced 43% to R8.5 billion
Free Cash Flow:
- Positive R0.8 billion
- First positive FCF in four years
- Improvement of more than 100% versus the prior period
Impairments:
- Total impairments of R7.8 billion
- R3.0bn (Secunda)
- R3.9bn (Mozambique PSA)
- R0.5bn (CTT)
- EBIT declined 52%
Net Debt:
- Stood at US$3.8 billion
- Slightly above long-term target of below US$3 billion
- Year-end target set below US$3.7 billion
⚙️ Operations & Safety
- Management highlighted safety focus following a fatal incident
- Secunda production increased 10%
- De-stoning plant now operating at full capacity
- Gas startup delays and revised PSA volumes slowed monetization
- Throughput remained constrained despite operational improvements
🌱 Grow and Transform Strategy
- Over 1.2 GW of renewables contracted toward 2 GW by 2030 target
- Secured approximately 9 million tonnes of carbon offsets
- Zaffra JV awarded EUR 350 million grant
- Targeting ~2,000 barrels per day eSAF production
- First production expected around 2030
Operational Improvements Support Outlook
Operationally, Sasol is showing signs of improvement.
- Enhanced coal quality at Secunda has boosted production output
- The recovery of the Natref refinery has improved fuel supply capacity
- Fuel sales expectations for 2026 have been revised higher
Outlook: Volatility Remains the Dominant Theme
Overall, Sasol remains highly exposed to swings in crude oil prices, with short-term rallies offering relief but not yet shifting the broader structural narrative. While balance sheet progress is encouraging, investor sentiment continues to be shaped by commodity volatility and longer-term energy transition risks.
- Check out our free forex signals
- Follow the top economic events on FX Leaders economic calendar
- Trade better, discover more Forex Trading Strategies
- Open a FREE Trading Account
- Read our latest reviews on: Avatrade, Exness, HFM and XM
Related Articles


Sidebar rates
Related Posts
