Gold Turns Bearish at the 100 SMA After Last Week’s Retrace Higher
Gold was retracing higher last week after completing the Elliott Wave Pattern, but now the pullback is complete
Gold turned bearish at the middle of February after trading on a bullish trend since last summer. Since then we have seen three bearish waves on the daily chart and two smaller retracing bullish waves, so it looks like an Elliott Wave Pattern has unfolded in the last two months.
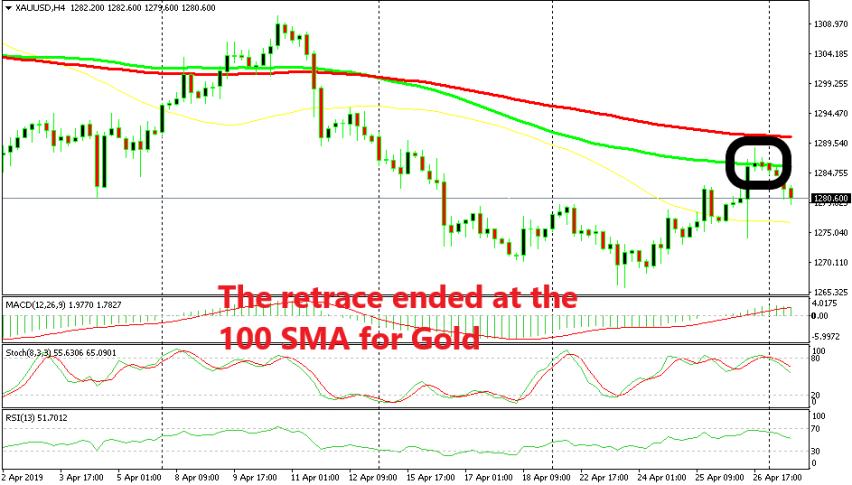
That pattern ended last week at the 100 SMA on the daily chart and Gold retraced higher during most of last week. But the retrace is now complete on the H4 time-frame and the stochastic indicator is now turning down from overbought levels. The retrace ended at the 100 SMA (green) on this chart.
This moving average has provided resistance and support before, so it is now working as resistance again. Besides that, the price formed an upside-down hammer candlestick which is a reversing signal after the bullish retrace.
Now the price is reversing down again, so the upside should be over for Gold and the buyers should be in charge for some time. If you have sold or are selling Gold now, make sure to place the stop above the 100 smooth MA (red).
- Check out our free forex signals
- Follow the top economic events on FX Leaders economic calendar
- Trade better, discover more Forex Trading Strategies
- Open a FREE Trading Account
- Read our latest reviews on: Avatrade, Exness, HFM and XM
Related Articles


Sidebar rates
Related Posts
