Microsoft Stock (MSFT) Tests Critical Support Zone: Buying Opportunity or Breakdown Risk?

Quick overview
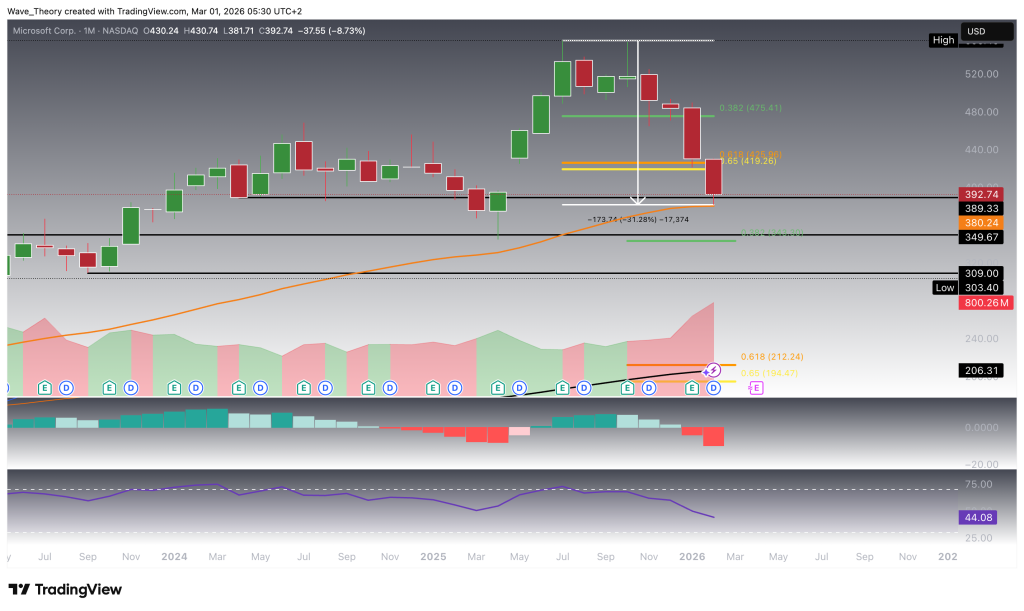
- Microsoft stock (MSFT) has experienced a significant correction of over 31% in the past five months, breaking key support levels and indicating a shift in market structure.
- Currently, MSFT is testing a critical support zone between $350 and $390, where a potential bullish bounce could occur if the support holds.
- Despite the long-term bullish trend, short- and medium-term indicators show bearish momentum, including a recent death cross on the daily chart.
- Key resistance levels to watch for a potential reversal are at $448 and $490, with a breakdown below $343 signaling further downside risk.
Microsoft Stock Trades Within Descending Channel as Price Tests 200-Week EMA Support
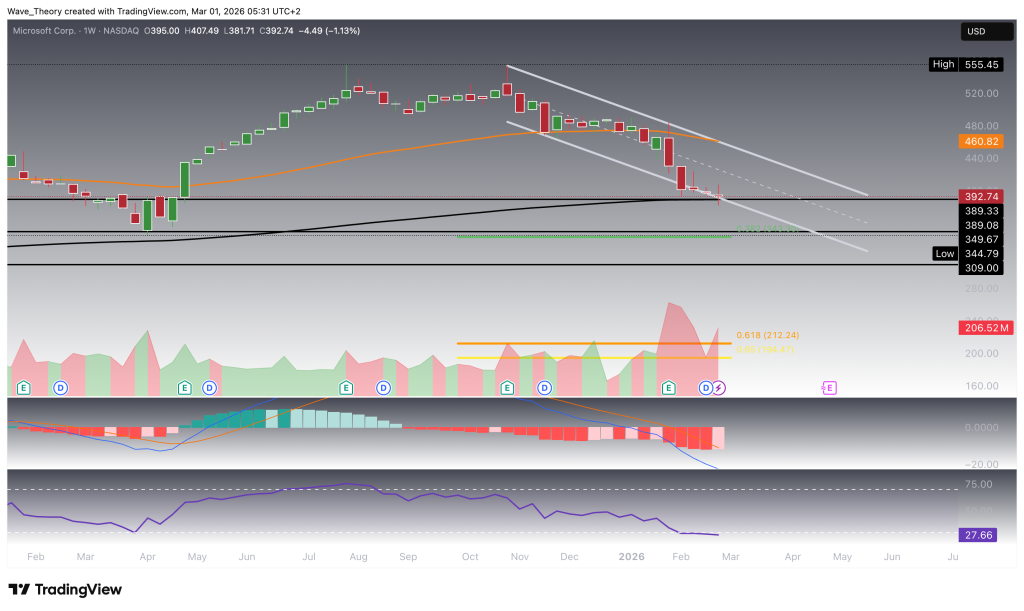
On the weekly chart, MSFT is clearly trading within a well-defined downward channel, reflecting a sustained corrective structure following its decisive breakdown below the 50-week EMA support around $461. This loss of a key trend-defining level confirmed a shift in medium-term momentum, paving the way for continued downside within the channel formation.
Currently, price is testing the 200-week EMA at approximately $389 — a critical dynamic support that often acts as a last line of defense in longer-term bullish trends. A successful hold at this level could provide the foundation for a relief rally within the channel. However, should this support fail to hold, the next significant downside targets are defined by Fibonacci retracement levels at $343 and, in an extended correction scenario, as low as $200. This level acts as key support level to maintain the overlying upward trajectory.
From a momentum standpoint, early signs of potential stabilization are emerging. The MACD histogram has begun to tick bullishly higher this week, indicating a gradual reduction in bearish momentum. Nevertheless, the MACD lines remain bearishly crossed, suggesting that the broader corrective trend is still intact. At the same time, the RSI has entered oversold territory, a condition that often precedes short- to medium-term relief bounces.
Overall, MSFT is approaching a technically critical juncture, where the reaction to the 200-week EMA will likely determine whether the stock can stage a recovery within its downtrend or extend its correction toward deeper support levels.
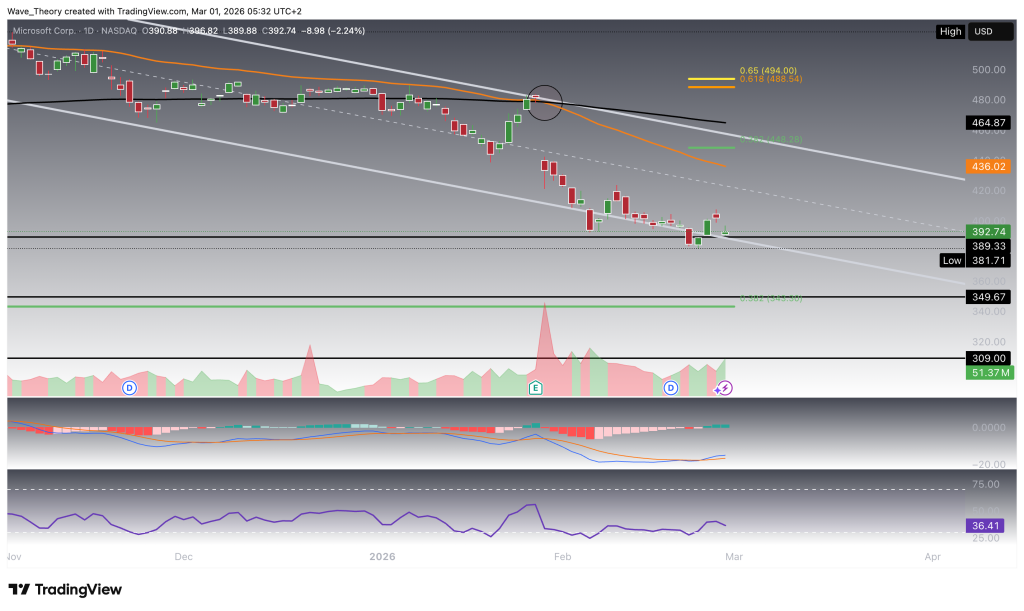
Death Cross on Daily Chart Signals Bearish Bias Amid Emerging Bullish Momentum
On the daily timeframe, MSFT has formed a death cross, with the shorter-term EMAs crossing below the longer-term averages, thereby confirming a bearish trend in the short- to medium-term outlook. This development reflects persistent downside pressure and aligns with the broader corrective structure observed across higher timeframes.
In contrast, early signs of a potential counter-trend recovery are beginning to emerge. The MACD lines have crossed bullishly, while the MACD histogram is trending higher, indicating building upside momentum in the near term. Meanwhile, the RSI remains in neutral territory, providing no clear directional bias and suggesting that price is not yet in an overextended condition.
Should MSFT initiate a bullish bounce from current levels, the next key upside targets are defined by Fibonacci resistance levels at $448 and $490. The $490 level, representing the golden ratio, is particularly critical — only a decisive break above this threshold would invalidate the ongoing corrective phase and signal a structural shift back into a broader bullish trend. In such a scenario, MSFT could target a move toward its all-time high at $555.5 and potentially extend beyond it.
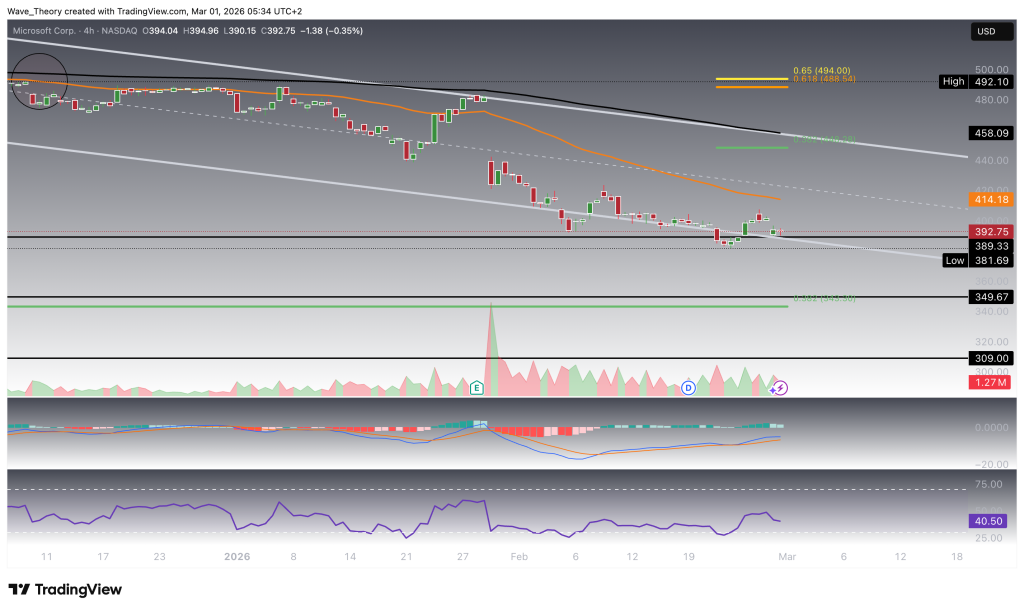
Mixed Signals on the 4H Chart as Microsoft Stock Tests Critical Support
On the 4-hour chart, MSFT presents a mixed technical outlook, reflecting an ongoing battle between short-term bearish trend structure and emerging counter-trend momentum. The EMAs have formed a death cross, confirming a bearish trend in the immediate term and indicating that downside pressure remains dominant on lower timeframes.
At the same time, momentum signals are not fully aligned. The MACD histogram has started to tick bearishly lower, suggesting weakening upside momentum, while the MACD lines remain bullishly crossed — a divergence that often precedes increased volatility or indecision. Meanwhile, the RSI continues to move in neutral territory, offering no clear directional bias.
Given that MSFT is currently testing a major higher-timeframe support zone, the potential for a relief rally remains significant. In a bullish reaction scenario, the stock could see upside potential in the range of approximately 18% to 30%, targeting nearby resistance clusters.
However, the downside risk remains clearly defined. Should the current support fail to hold, MSFT could extend its decline by another 10%, before approaching the next major support at the 0.382 Fibonacci retracement level around $343 — a level that could serve as the next key inflection point for price action.
Microsoft
MSFT at Critical Support — Key Levels in Focus
MSFT is testing a major confluence support zone between $350 and $390, defined by the 50-month EMA (~$380) and the 200-week EMA (~$389). While the long-term trend remains bullish, the medium- and short-term structure is bearish, following breakdowns below $475 and $420 and the formation of a daily death cross.
Momentum signals are mixed, with early signs of a potential relief bounce, but no confirmed reversal yet.
Key Supports: $380, $389, $350–$390, $343, $200
Key Resistances: $448, $490 (critical), $555.5
Holding the current support zone keeps a bounce of 18–30% in play. A breakdown could extend losses toward $343 or lower, while a break above $490 is needed to invalidate the correction.
- Check out our free forex signals
- Follow the top economic events on FX Leaders economic calendar
- Trade better, discover more Forex Trading Strategies
- Open a FREE Trading Account
- Read our latest reviews on: Avatrade, Exness, HFM and XM
Related Articles


Sidebar rates
Related Posts
