Samsung Electronics stock recently surged to new all-time highs as investors aggressively price in the accelerating global demand for AI infrastructure. The rally is largely driven by booming demand for high-bandwidth memory used in AI systems, alongside growing expectations that Samsung could become a key supplier to Nvidia’s next-generation AI accelerators. At the same time, a sharp recovery in the memory chip cycle and rising semiconductor prices have significantly improved profit expectations, fueling strong institutional inflows into the stock.
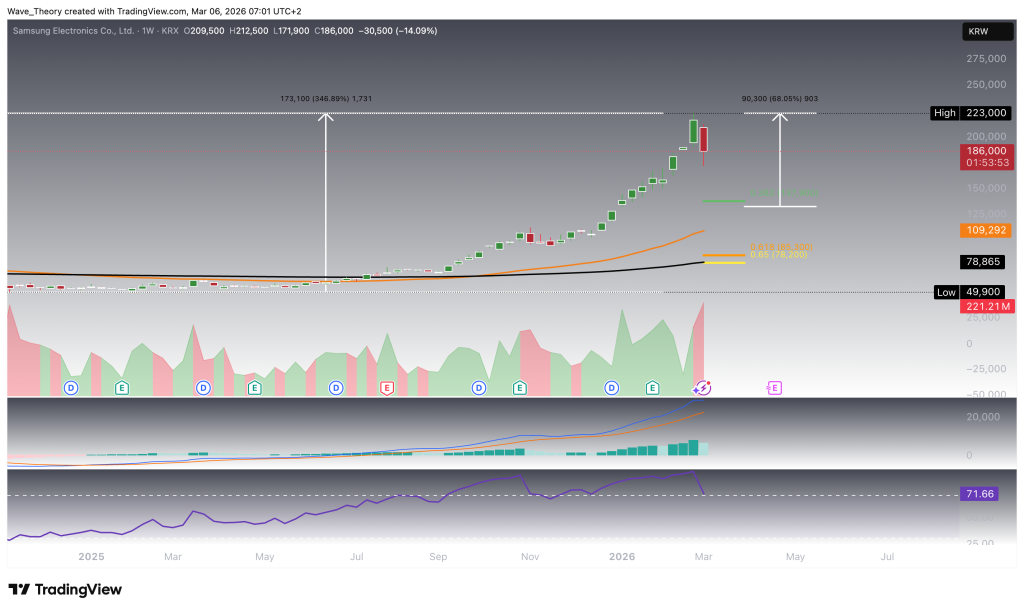
Samsung Stock Enters Correction Following Powerful 350% Rally
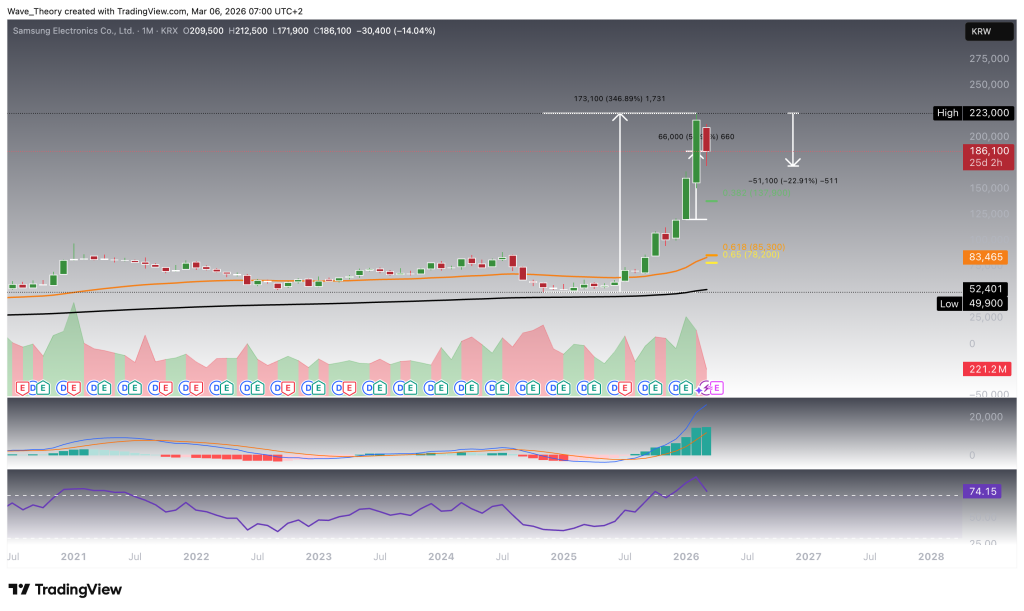
Since November 2024, shares of Samsung Electronics have delivered an extraordinary rally, appreciating by nearly 350% and ultimately establishing a new all-time high at 223,000 KRW last month. From a higher-timeframe perspective, the technical structure remains firmly bullish. On the monthly chart, the exponential moving averages continue to maintain a golden crossover, confirming the persistence of the long-term uptrend. Momentum indicators reinforce this constructive outlook: the MACD lines remain bullishly crossed, while the MACD histogram continues to print a clear upward trajectory, signaling sustained positive momentum. At the same time, the RSI has advanced into overbought territory, yet it currently shows no bearish divergence or clear reversal signals, indicating that momentum has not yet structurally deteriorated.
Despite this strong macro trend backdrop, Samsung stock has entered a corrective phase this month, declining by approximately 23% from its recent peak. From a technical retracement standpoint, this pullback could extend further toward the next major Fibonacci support at the 0.382 retracement level near 137,900 KRW, which represents the next significant area where buyers could potentially re-enter the market and attempt to stabilize price action.
Samsung Stock Surged By 68% Year-to-High Despite Emerging Pullback
Since the beginning of the year, shares of Samsung Electronics have surged by approximately 68%, reflecting a powerful continuation of the broader bullish trend. However, during the current week the stock has begun to experience a notable pullback, which could extend further toward the next significant Fibonacci support at the 0.382 retracement level around 137,900 KRW. Should this support fail to hold, the next major downside level emerges at the golden ratio support near 80,000 KRW, representing a deeper corrective zone within the broader uptrend structure.
From a momentum perspective, the MACD histogram has started to print a lower bar this week, indicating weakening upside momentum as the correction unfolds. Nevertheless, both the MACD lines and the exponential moving averages remain in a bullish configuration, suggesting that the mid-term trend structure continues to favor the upside. Meanwhile, the RSI remains elevated but has begun to retreat from overbought territory toward more neutral levels, signaling a gradual normalization of momentum following the stock’s extended rally.
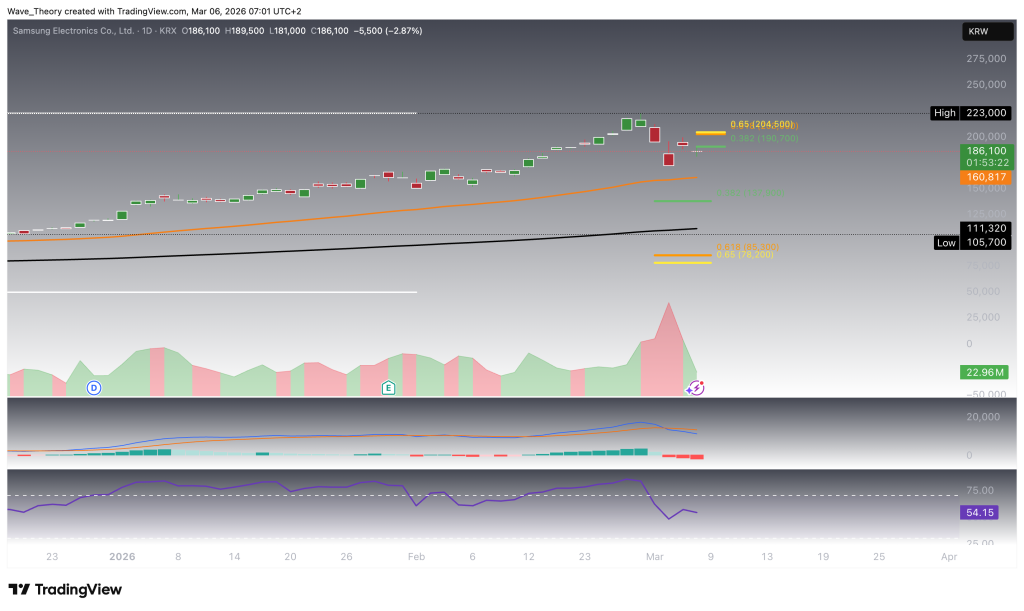
Samsung Stock Targets Next Significant Fibonacci Resistance Levels
Shares of Samsung Electronics currently find significant support at the 50-day EMA near 160,820 KRW, which is acting as the first key stabilization level during the ongoing pullback. On the upside, the stock faces major Fibonacci resistance levels at 190,700 KRW and 204,000 KRW. Only a decisive break above the golden ratio resistance at 204,000 KRW would invalidate the current corrective phase and potentially propel Samsung stock back toward its all-time high at 223,000 KRW, with the possibility of even establishing new highs.
That said, momentum indicators currently lean bearish on the daily chart. While the EMAs continue to maintain a golden crossover, confirming that the broader short- to mid-term trend structure remains bullish, momentum has begun to weaken. The MACD lines have crossed bearishly and the MACD histogram has been ticking progressively lower, signaling increasing downside pressure. Meanwhile, the RSI is moving in neutral territory, providing neither clear bullish nor bearish confirmation at this stage.
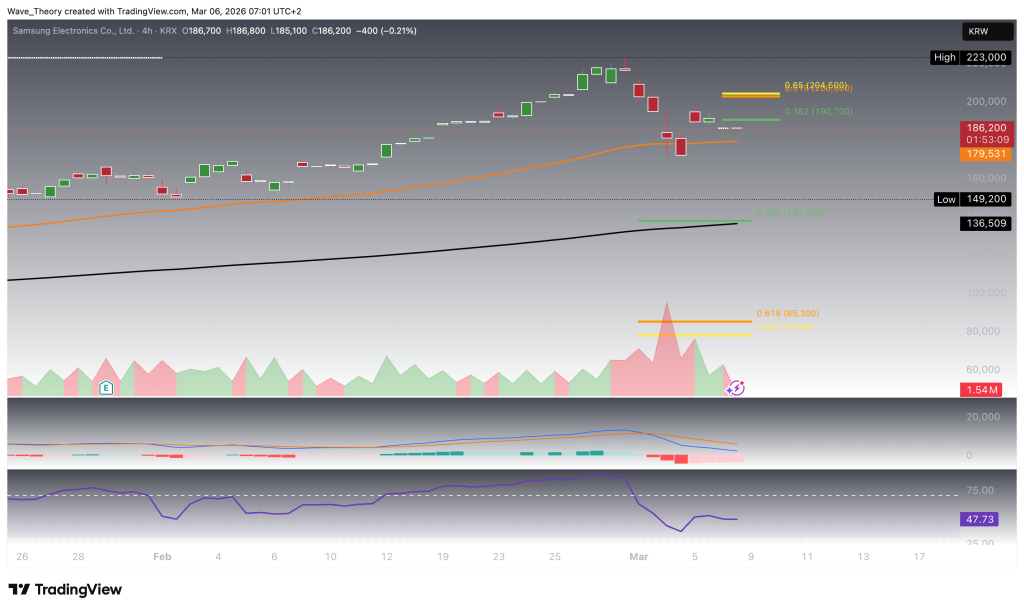
Rather Bullish Signals on the 4H Chart for Samsung Stock
On the 4-hour timeframe, indicators for Samsung Electronics present a predominantly bullish short-term outlook. The exponential moving averages have formed a golden crossover, confirming a bullish trend structure in the short term. Momentum indicators also show early signs of recovery, as the MACD histogram has recently begun ticking bullishly higher, suggesting strengthening upward momentum, even though the MACD lines remain bearishly crossed for now. Meanwhile, the RSI continues to move within neutral territory, offering neither a clear bullish nor bearish signal at this stage.
From a structural perspective, key dynamic support levels are clearly defined on this timeframe. Samsung stock currently finds significant support at the 50-period EMA on the 4H chart near 179,500 KRW, while a deeper support level lies at the 200-period EMA on the 4H chart around 136,500 KRW, which aligns closely with the 0.382 Fibonacci retracement level, creating a strong confluence support zone.