Is Robinhood (HOOD) Ready to Rally? Bullish Setup Emerging

Quick overview
- Robinhood (HOOD) stock has experienced a significant 55% correction but has recently rebounded by 22.5%, indicating potential buyer interest.
- The stock is approaching key resistance levels between $78 and $85, with a breakout above these levels potentially leading to further upside towards $101.5.
- Despite the recent recovery, mixed momentum indicators suggest that the broader corrective phase remains intact, particularly on shorter timeframes.
- A decisive breakout above $101.5 could signal a return to an uptrend, with the possibility of retesting all-time highs near $154.
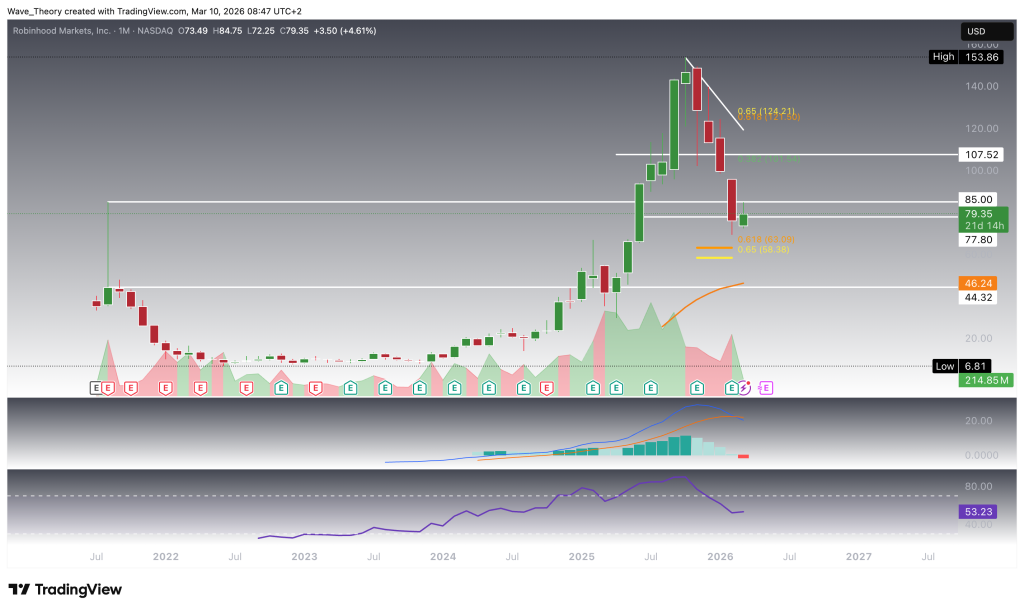
Robinhood (HOOD) stock has undergone a sharp correction after peaking near $154 in October 2025, ultimately bottoming around $69 last month. Since then, the stock has staged a notable rebound, suggesting that buyers are beginning to step back in following the aggressive drawdown. With momentum turning constructive, the key question now is whether HOOD has the technical foundation for further near-term upside or if this recovery rally is likely to stall at overhead resistance.
Robinhood Stock Down 55% — Is a 33% Upside Move Next?
Robinhood Markets (HOOD) stock has undergone a sharp 55% correction, ultimately missing the golden ratio support at $63 by roughly 8% before establishing a recent low and initiating a recovery. Since then, the stock has begun to rebound and is now approaching a key horizontal resistance zone between $78 and $85. A confirmed bullish breakout above this resistance cluster would open the door for a continuation move toward the next major Fibonacci resistance at $101.5, which would imply additional upside potential of approximately 33% from current levels.
Should HOOD successfully break above the 0.382 Fibonacci resistance at $101.5, the next technically significant hurdle emerges at the golden ratio resistance near $124. Only a decisive breakout above this critical Fibonacci level would invalidate the broader correction phase and signal that Robinhood has re-entered its primary uptrend. In that scenario, the stock could retest its all-time high near $154, with the possibility of even establishing new highs beyond that level.
For now, however, Robinhood remains technically within a correction phase, albeit with the potential for a bullish rebound in the near term. On the monthly timeframe, the MACD lines have produced a bearish crossover, while the MACD histogram has continued to tick lower for several consecutive months, reflecting lingering downside momentum. Meanwhile, the RSI remains positioned in neutral territory, suggesting that momentum conditions are not yet oversold and leaving room for further directional development.
Robinhood Stock Has Already Rebounded by 22.5%
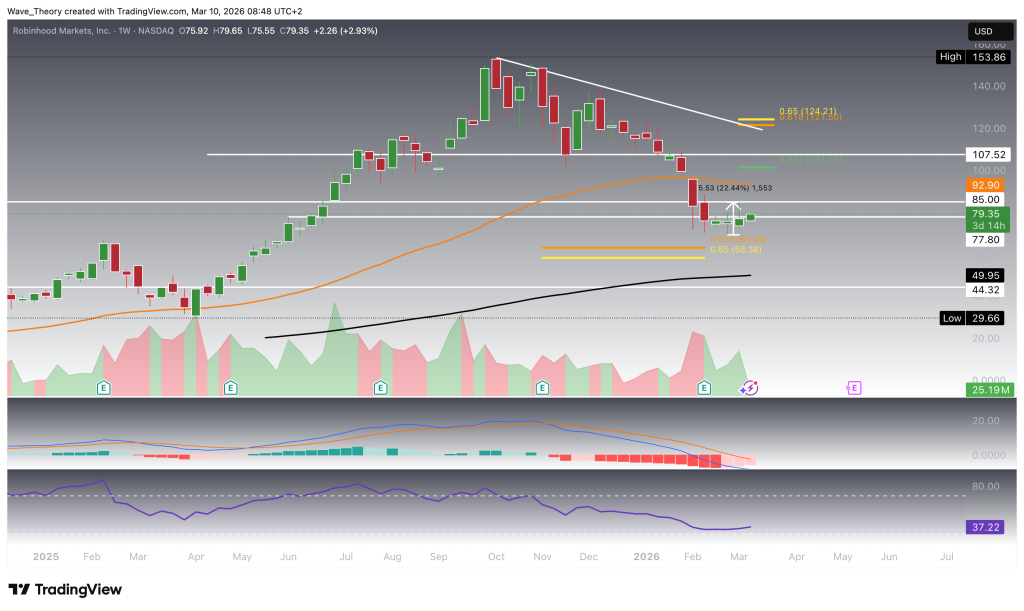
On the weekly timeframe, Robinhood Markets (HOOD) has already staged a notable recovery, with the stock rising roughly 22.5% from its recent low. At the same time, the MACD histogram has been printing bullish bars for three consecutive weeks, indicating that upward momentum has been gradually building during the rebound phase.
From a trend perspective, the EMAs continue to maintain a golden crossover on the weekly chart, which confirms that the mid-term trend structure remains bullish despite the broader corrective phase that followed the prior peak.
However, momentum indicators remain somewhat mixed. The MACD lines are still bearishly crossed, suggesting that the broader momentum structure has not yet fully flipped to bullish. Meanwhile, the RSI continues to move in neutral territory, providing neither a clear bullish nor bearish signal at this stage.
If Robinhood extends its current recovery and continues its upward trajectory, the stock faces its next significant resistance at the 50-week EMA around $93, which represents the next major technical barrier that bulls would need to overcome to sustain the rebound.
Death Cross Emerges on the Daily Chart for Robinhood
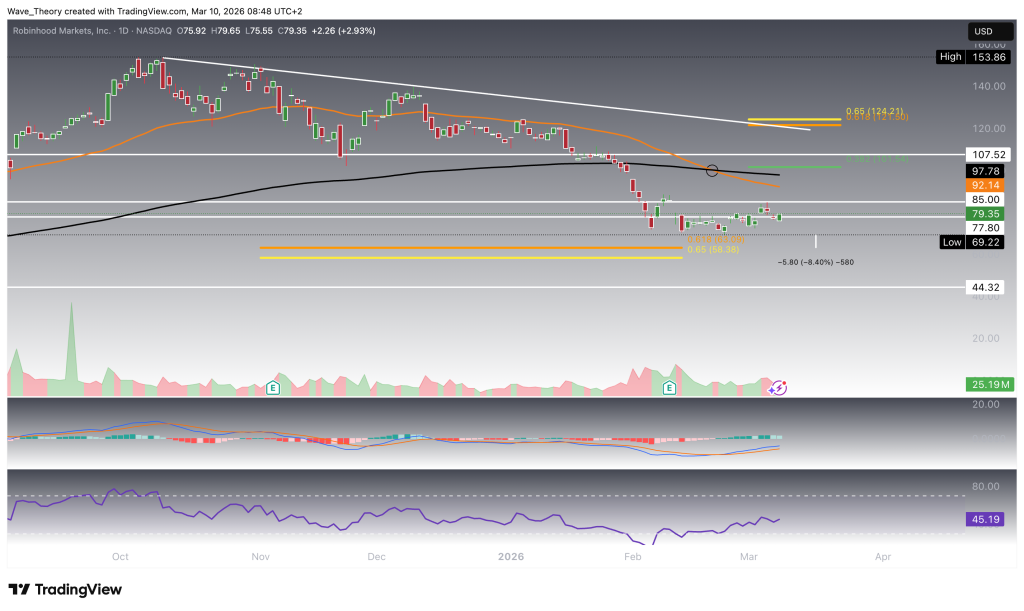
On the daily timeframe, Robinhood Markets (HOOD) has established a death cross, as the shorter-term EMAs have crossed below the longer-term EMAs. This development confirms the trend bearishly in the short- to medium-term, indicating that the broader corrective structure remains intact despite the recent rebound.
Momentum indicators, however, present a mixed picture. The MACD lines are currently bullishly crossed, suggesting that short-term upside momentum is still present. At the same time, the MACD histogram has started to tick bearishly lower since yesterday, which could indicate that bullish momentum is beginning to lose strength. Meanwhile, the RSI continues to move in neutral territory, offering no clear directional signal at this stage.
Despite the bearish EMA structure, a continuation of the current bullish bounce appears plausible in the near term. Should the recovery extend further, Robinhood is likely to encounter major resistance around the 0.382 Fibonacci level at $101.5, where the stock could face a potential rejection as sellers re-enter the market.
Similar Technical Outlook on the 4H Chart
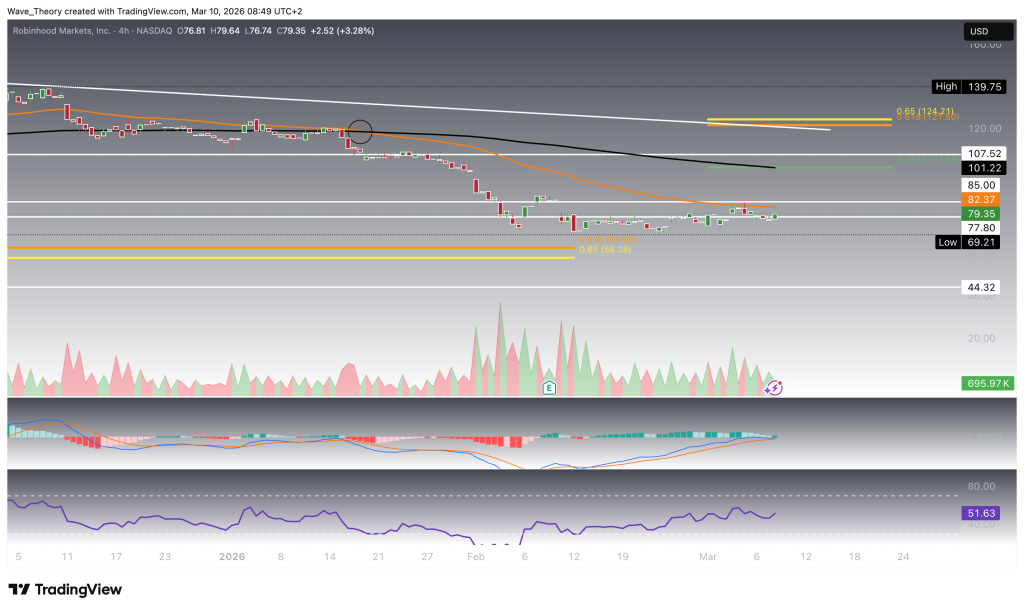
On the 4-hour timeframe, Robinhood Markets (HOOD) presents a similar technical setup to the higher timeframes. The EMAs have formed a death cross, which confirms the short-term trend bearishly. At the same time, momentum indicators suggest a more balanced picture. The RSI remains in neutral territory, while the MACD histogram has started to tick bullishly higher, signaling a gradual improvement in short-term momentum. Additionally, the MACD lines remain bullishly crossed, further supporting the potential for continued near-term upside.
In terms of price structure, Robinhood currently faces significant resistance at the 50-period EMA on the 4H chart around $82. The stock recently faced rejection at this level, which pushed the price back toward the lower boundary of the broader resistance zone between $78 and $85.
If Robinhood manages to break above the 50-4H-EMA, the next major technical barrier would emerge at the 200-4H-EMA, which aligns confluently with the 0.382 Fibonacci resistance at $101.5. This area represents a key resistance cluster where the stock could encounter stronger selling pressure.
Robinhood Stock: Summary & Key Levels to Watch
Robinhood Markets (HOOD) remains in a broader correction phase after a 55% decline, but the stock has recently staged a 22.5% rebound, suggesting that a short-term bullish bounce is underway. While higher timeframes still show mixed momentum signals, the mid-term trend structure remains supported by the weekly EMA golden crossover, even as shorter timeframes display death crosses, reflecting lingering corrective pressure.
In the near term, $78–$85 represents the first key resistance zone, with the 50-4H EMA near $82 acting as an immediate technical barrier. A breakout above this area could open the path toward the 50-week EMA around $93, followed by the 0.382 Fibonacci resistance at $101.5, which represents the next major upside target and a critical decision level where rejection could occur.
If Robinhood manages to break above $101.5, the next significant resistance emerges at the golden ratio near $124. Only a decisive breakout above this level would invalidate the broader correction and confirm a return to the primary uptrend, potentially allowing the stock to retest or surpass its all-time high near $154.
- Check out our free forex signals
- Follow the top economic events on FX Leaders economic calendar
- Trade better, discover more Forex Trading Strategies
- Open a FREE Trading Account
- Read our latest reviews on: Avatrade, Exness, HFM and XM
Related Articles


Sidebar rates
Related Posts
