Gold’s $5,000 Tug-of-War: Is the Bulls’ Multi-Year Supercycle Facing a Fatal Breakdown?
As of March 16, 2026, the gold market is in a tough spot. Earlier this year, XAU/USD broke records above $5,600, but now prices...

Quick overview
- As of March 16, 2026, gold prices are struggling to maintain levels above $5,000 after reaching record highs earlier in the year.
- Short-term pressures from profit-taking, margin calls, and a stronger US Dollar are impacting the gold market, despite long-term support from central bank purchases.
- Technical indicators show a bearish trend, with critical support at $4,908 and resistance at $5,064, suggesting potential volatility ahead.
- The upcoming Federal Reserve meeting could significantly influence gold prices, making $5,000 a pivotal level to watch in 2026.
As of March 16, 2026, the gold market is in a tough spot. Earlier this year, XAU/USD broke records above $5,600, but now prices are struggling to stay above $5,000. Long-term, central banks and a changing global reserve system still support gold, but in the short term, profit-taking, margin calls, and a stronger US Dollar are weighing on the market. For the first time in months, buyers looking for bargains are facing strong selling pressure that could change the technical outlook.
With ten years of experience in the markets, I see a rare liquidity squeeze happening now. Normally, rising tensions in the Middle East push gold prices higher. But even as the Iran conflict affects global energy supplies and keeps oil prices high, gold is falling. This unusual move shows that traders are selling gold to cover losses in other areas, which could be a big opportunity for those who can look past short-term swings and focus on long-term value.
The Fed’s “Inflation Trap”: Why $5,000 is the New Pivot Point
The main challenge for gold this week is the Federal Reserve’s policy meeting on March 18. Disruptions in the Strait of Hormuz have pushed energy prices higher, raising inflation expectations and ending hopes for quick rate cuts. Now, the market sees a 99.2% chance that the Fed will keep rates between 3.50% and 3.75%. This has made the US Dollar stronger, which makes holding gold less attractive since it doesn’t pay interest.
Even with these challenges, gold’s support level remains strong. Central banks in emerging markets are still buying, with Goldman Sachs estimating about 70 tonnes purchased each month. This isn’t just speculation; it’s a shift in how global reserves are managed. Even if the Fed waits until June or September to cut rates, steady demand from central banks offers a safety net that wasn’t there in past cycles.
Gold (XAU/USD) Technical Deep-Dive: The Descending Channel and the $4,908 Target
Looking at the charts, there are clear warning signs on the 2-hour and 4-hour timeframes. Gold has dropped below both its 50-period and 200-period moving averages, which now act as resistance. The price is moving in a downward channel, with lower highs below the $5,320 trendline. Breaking below the $5,064 support shows that sellers are leading in the short term.
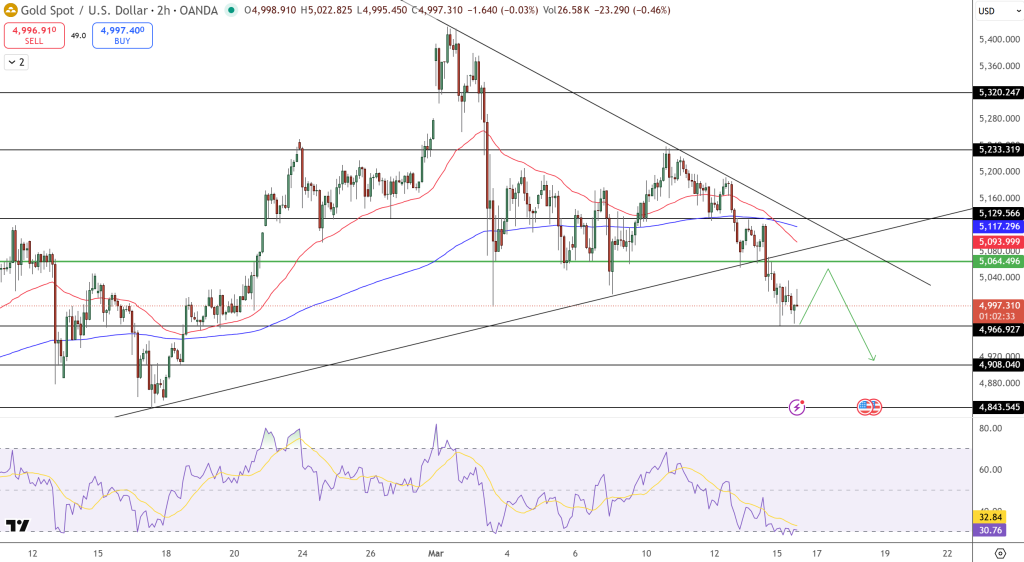
The Relative Strength Index (RSI) is currently hovering near 31, signaling that we are entering “oversold” territory. However, in a parabolic correction, oversold can become “more oversold” before a meaningful bounce occurs. If the bears can maintain a daily close below $5,000, the technical roadmap points directly to a liquidity test at $4,908. Conversely, a sharp rejection of the $4,960 support zone would be the first sign that the bull cycle is preparing for its next leg higher.
- Primary Resistance: $5,064 (Previous support-turned-resistance) and $5,129.
- Critical Support: $4,966 followed by the structural floor at $4,908.
- Momentum View: Bearish bias prevails while price trades below the $5,117 (200-MA).
- Strategy Tip: Watch for “wicking” candles below $5,000—institutional buyers often use these “false breaks” to accumulate positions from panicked retail sellers.
The Weekly Verdict: Strategic Patience Amidst the Chaos
For the week of March 16–22, 2026, staying disciplined is key. The FOMC announcement could either push gold down toward $4,800 or trigger a big rally above $5,200. While short-term signals favor sellers, the long-term bull market, which is up 70% over the past year, is still strong.
In this market, volatility in paper trading can hurt traders who react emotionally. Moving from fear to cautious optimism will take time, but factors like central bank buying, global tensions, and de-dollarization are still driving the market. Whether you trade daily or hold for the long term, $5,000 is a key level for gold in 2026.
- Check out our free forex signals
- Follow the top economic events on FX Leaders economic calendar
- Trade better, discover more Forex Trading Strategies
- Open a FREE Trading Account
- Read our latest reviews on: Avatrade, Exness, HFM and XM
Related Articles


Sidebar rates
Related Posts
