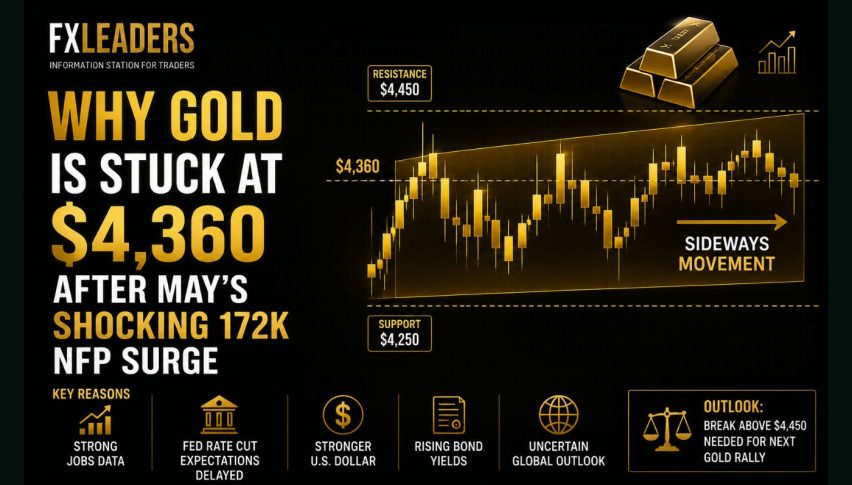
Why Gold is Stuck at $4,360 After May’s Shocking 172K NFP Surge
Gold dealers are left stunned. In the final few hours of Thursday, June 5, 2026, spot gold was moving within a tight and highly limiting...
Quick overview
- Gold prices hovered around $4,362 an ounce as a strong US jobs report shifted market expectations for interest rates.
- The Bureau of Labor Statistics reported 172,000 new jobs in May, significantly surpassing forecasts and supporting a tight monetary policy.
- Central banks, particularly China's, continue to aggressively buy gold, providing a structural support for prices despite short-term headwinds from rising yields.
- Gold's technical outlook shows a tight trading structure, with potential long positions forming around $4,362, while resistance remains at $4,428.
Gold dealers are left stunned. In the final few hours of Thursday, June 5, 2026, spot gold was moving within a tight and highly limiting intraday band as it hovered near $4,362 an ounce. The sideways, defensive price movement comes just days after a major US jobs report that has dramatically altered the outlook for US interest rates on Wall Street.
The latest numbers came from the Bureau of Labor Statistics, which reported 172,000 nonfarm payroll jobs were added in May, vastly exceeding expectations that had pointed to just 80,000 jobs. In addition, jobs from previous months were upward revised a combined 93,000 and average hourly earnings were up 0.3% from the previous month, both of which support the notion that the US economy is holding up well despite elevated rates. While the unemployment rate remained steady at 4.3%, the better-than-expected employment data provides Fed chair Kevin Warsh with the leeway he needs to maintain a tight, higher-for-longer policy regime.
The jobs report contributed to a rally in the US dollar index and pushed real yields higher in the wake of a 4.1% core inflation rate and 3.8% headline CPI. The lack of yield in gold means that higher yields are a drag on prices in the near term.
Central Bank Accumulation Reaches Month 17
With core inflation already burning at 4.1% and headline CPI stuck at 3.8%, the hot labor report sent the U.S. Dollar Index spiking and pushed real yields higher. Because gold pays no yield, this macro shift acts as a severe near-term headwind.
However, gold’s long-term floor remains structural, driven by historic global reserve diversification:
- The Sovereign Buying Floor: China’s People’s Bank of China extended its aggressive physical gold-buying program to an unprecedented 17th consecutive month, aggressively absorbing spot supply to hedge against Western debt systems.
- De-Dollarization Shift: A broad coalition of emerging-market central banks are continuously rotating out of G7 fiat currencies into physical bullion, keeping global demand insulated from short-term futures market liquidations.
- Fragile Border Ceasefires: The nine-week-old conditional U.S.-Iran ceasefire continues to preserve normal commercial transit through the Strait of Hormuz. While this has temporarily sucked out immediate safe-haven premiums, geopolitical trading desks treat the regional calm as highly tenuous.
Gold Technical Outlook: Trading the $4,368 Structural Convergence
Gold ($4,362.45) sits within an intricate and highly limited trading structure on the four-hour time frame, which provides an interesting setup for swing traders. It is sandwiched within a tightening macro structure defined by a descending dynamic channel on the upside and a solid, multi-touch, ascending black trendline rising off its springtime lows on the downside.
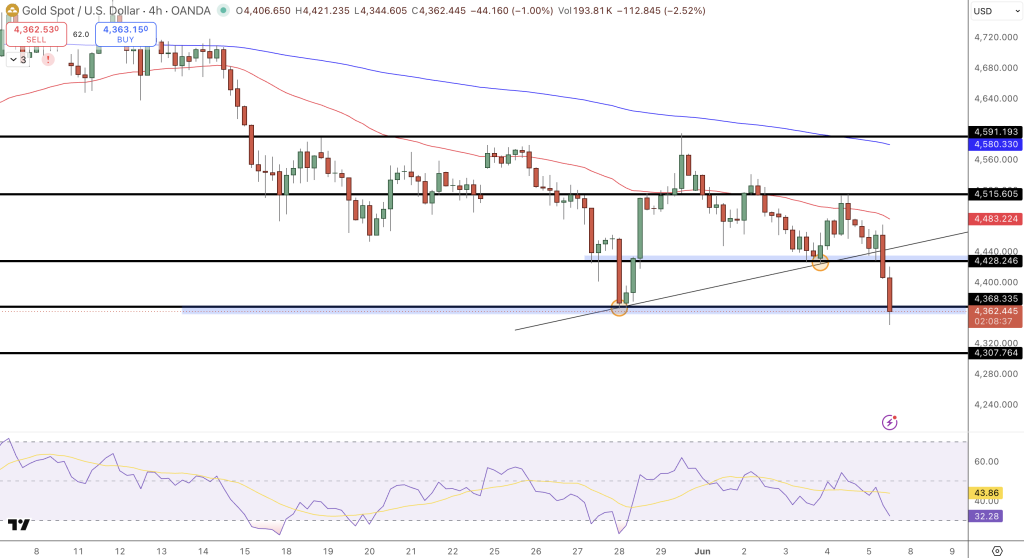
While overhead dynamic resistance trendlines descending from the recent $4,721 peak have repelled the metal numerous times, buyers have consistently stepped in during the selloffs. Significant lower wicks in the price action demonstrate significant demand at the $4,368-$4,428 area.
With the 14-period relative strength index sitting at 43, which has started to show divergence from recent price lows, traders could place long positions at $4,362 or wait for a confirmed hourly candle close above the dynamic resistance trigger at $4,428. A tight stop loss below the $4,368 level on the trendline should be used to target $4,515 once the market has digested the data print. Ultimately, the price movement of gold remains in line with macro expectations.
While chair Warsh’s hawkish data runway might keep near-term spot prices capped, central banks in the emerging market world and other countries continue to purchase physical bullion to help diversify their reserves.
- Check out our free forex signals
- Follow the top economic events on FX Leaders economic calendar
- Trade better, discover more Forex Trading Strategies
- Open a FREE Trading Account
- Read our latest reviews on: Avatrade, Exness, HFM and XM
Related Articles


Sidebar rates
Related Posts
Ava

