Why Ethereum Shed 15% in a Month Amid a Historic ETF Cash Drain; What’s Next?
Ethereum coin seems unable to stop its negative performance, and it is now trading at 1,678 dollars, showing a more than 5 percent decline.
Quick overview
- Ethereum is currently trading at $1,678, reflecting a decline of over 5% and more than 15% over the past month.
- Significant outflows from Ethereum ETFs, including $44 million in a single day, are contributing to the coin's negative performance.
- The overall crypto market is experiencing weakness, with a loss of over $100 billion recently, further impacting Ethereum's price.
- Analysts predict that if outflows continue, Ethereum could retest the $1,500 support level due to ongoing selling pressure.
Ethereum coin seems unable to stop its negative performance, and it is now trading at 1,678 dollars,
showing a more than 5 percent decline. For example, over the last month, this coin has fallen by more
than 15 percent. Looking at the last five days, it has lost more than 8 percent. On 19 May, this coin was
trading at around 2,100 dollars. But since then, it has shown such a weak performance.
Big Ethereum ETF Money Outflows
However, there are many reasons behind this negative performance. But the biggest reason is the high
outflows from spot Ethereum ETFs in the market. Right now, the outflows from these ETFs are increasing very rapidly. For example, reports show more than 44 million dollars outflow in just one day recently.
In addition, BlackRock’s ETF saw around 35 million dollars withdrawal while Fidelity lost more than 9 million dollars. So this is having a very negative impact on Ethereum’s price. Not only this, but the ETFs have seen outflows for 15 straight days which added hundreds of millions in selling pressure overall.
Crypto Market Feeling Very Weak
Besides that, the overall crypto market mood is also not good, which is also affecting ETH a lot.
According to reports, the total crypto market has lost more than 100 billion dollars in recent sharp
drops. For example, last week the entire market saw big value wipeout.
In addition, on June 4 the market cap dropped sharply while the Fear and Greed Index fell to just 12 in extreme fear zone. This is increasing selling pressure in the market.
All of this has greatly hurt Ethereum’s price. Secondly, government and macro concerns like inflation, geopolitical tensions, and recession fears are making investors more cautious.
Ethereum Performance Shows Weakness
Moreover, the coin’s weak performance is also proven by its recent market movement. According to the
data, the coin is now trading nearly 66 percent below its all-time high near 4,950 dollars. For example, it
has dropped more than 16 percent in the last seven days. In addition, the coin is trading well below its
50-day moving average, and the RSI has fallen to around 32 in the oversold zone. It has faced strong
selling in its recent weeks and collected limited buying support.
Seeing such weak conditions, many analysts have lowered their short term expectations. Now they
expect more pressure in the coming days. In addition, they are expecting that if outflows continue,
Ethereum could retest the 1,500 dollars support level.
Ethereum (ETH/USD) Price Prediction: Technical Breakdown Sets Stage For $1,500
Daily time frame analysis depicts a stark picture of near-term seller dominance. This means that tactical traders must observe key horizontal zones.
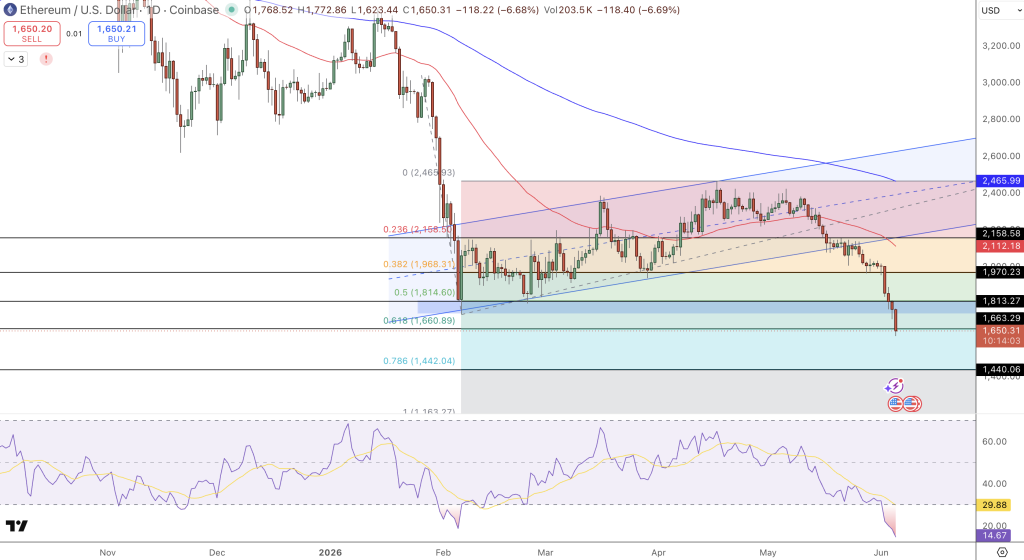
- Fibonacci: ETH price ($1,650.31) is trending lower on heavy volume and is below 0.618 fibonacci zone ($1,660.89)
- Red descending channel: Ethereum is trading far below both 50- and 100-day moving average, it is also constrained below red descending trendline from above $3,200 highs of past few months
- MACD/RSI (14): RSI is at deep oversold levels around 29.88, but there is no visible structural divergence. If daily close confirms break below 0.618 zone, there can be full macro retest of the 100% psychological support at $1,500 and lower levels up to $1,440 support
- Short: High probability short opportunity for the continuation of price move below the channel at $1,660 (residual stop loss can be placed at $1,813). Price target is $1,440.
All in all, Ethereum is being caught in a perfect macro squeeze. Until there is a halt in outflows from spot ETF or Congress passes a legislation that provides much-needed clarity on crypto, Ethereum will remain under pressure and offer great accumulation levels.
- Check out our free forex signals
- Follow the top economic events on FX Leaders economic calendar
- Trade better, discover more Forex Trading Strategies
- Open a FREE Trading Account
- Read our latest reviews on: Avatrade, Exness, HFM and XM
Related Articles


Sidebar rates
Related Posts
