Gold Holds $4,785–$4,810 as US-Iran Diplomatic Hopes Ease Safe-Haven Demand – Breakout Above $4,830 in Focus?
Spot gold is hovering around the $4785-$4810 per ounce mark on April 17th, showing a bit of weakness or just consolidating...
Quick overview
- Spot gold is currently trading between $4785 and $4810 per ounce, showing slight weakness after peaking at $4841 mid-week.
- Optimism regarding US-Iran diplomacy is influencing market sentiment, while uncertainties around the Strait of Hormuz are providing some price support.
- Gold is on track for a fourth consecutive weekly gain, recovering from March lows, but analysts remain bullish due to ongoing geopolitical risks.
- Technical analysis indicates gold is consolidating above key support levels, with resistance around $4830-$4850 and a potential trade idea to buy above $4830.
Spot gold is hovering around the $4785-$4810 per ounce mark on April 17th, showing a bit of weakness or just consolidating, with some small price moves (down roughly 0.05-0.3% in early trading – depending on the exact timing and source you’re looking at).
Recent Gold Price Action
Gold is kind of drifting lower or just holding steady, backing off a bit from those mid-week peaks near $4841. You know, it’s still way down from that January all-time high of over $5600 but it’s still up a pretty significant 39% or so from a year ago in some measures.
What’s Driving the Market Today
- Optimism about US-Iran Diplomacy: It looks like hopes for ceasefire extensions and renewed talks might be easing some of the risk premiums – and that’s supporting risk appetite and making the dollar a bit stronger at times. Which can put a bit of pressure on the non-yielding metal in the process.
- Uncertainty Around the Ongoing Blockade: The US naval blockade and all the uncertainties around the Strait of Hormuz are still keeping a bit of a floor under prices, because if the talks break down, safe-haven buying and oil-driven inflation concerns could come back to the fore in a hurry.
- Other Factors at Play: You’ve got a pretty mixed US dollar at the moment, expectations around what the Fed might do (some of the officials are talking about delays in rate cuts because of energy price impacts), steady central bank buying (like the People’s Bank of China is still accumulating gold), and physical demand in Asia and ETF flows that are helping to support the price – although profit-taking has started emerging now that things have calmed down a bit after that recent volatility.
Broader Market Context
Gold has been a bit choppy in April but it’s actually on track to make a fourth straight weekly gain (or close to flat), recovering from those dips it took earlier after the conflict-related volatility. It’s actually rebounded from those March lows around the $4300-$4500 range.
Longer term, most analysts are still pretty bullish on gold due to all the persistent geopolitical risks, de-dollarization trends, central bank diversification – and stagflation concerns. They’re still forecasting $5,000-$5,400 or higher for end of 2026 (with some even higher in their more optimistic scenarios) but of course near-term moves are still going to be heavily dependent on US-Iran headlines and oil dynamics.
Technical Analysis on XAU/USD
Gold is basically consolidating in the $4780-$4820 zone, holding above that key support area around $4780-$4783 which used to be resistance. The price is also still holding above that rising trendline – and that means the overall bullish structure is still intact even though it’s just going sideways at the moment.
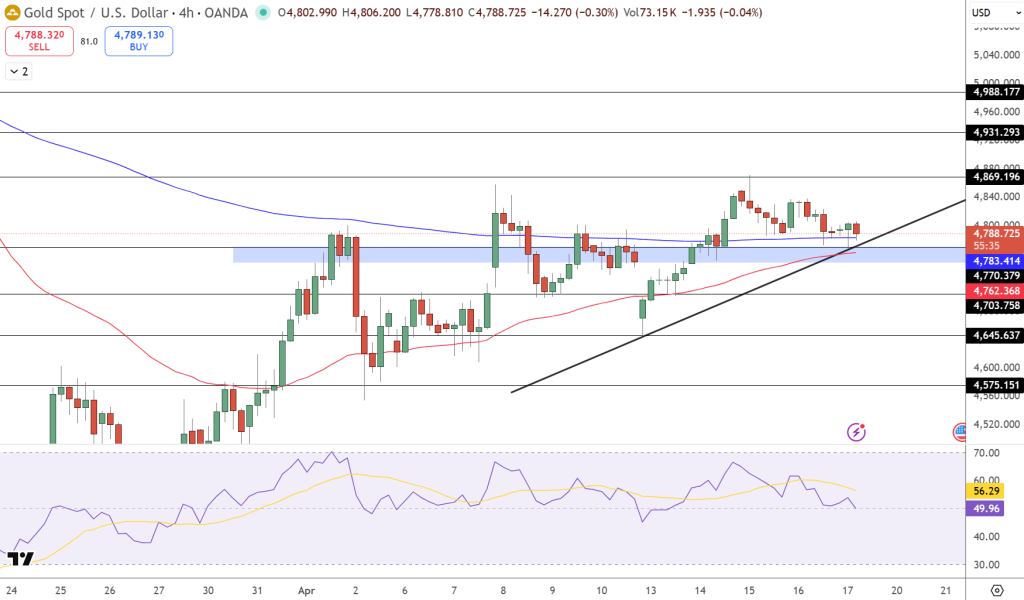
The market is actually struggling to break higher towards $4840-$4870 – which could be a sign of temporary exhaustion after that recent rally. But on the other hand, the lack of strong selling pressure shows that the buyers are still defending dips.
From a momentum perspective, the Relative Strength Index (RSI) is kind of hovering around 50-55 – which is often a sign of a pause before the next move in either direction.
Key Levels to Watch
- Resistance: $4830-$4850 → $4900+
- Support: $4780 → $4760-$4700
Trade Idea: Buy above $4830 targeting $4900+, stop below $4780.
- Check out our free forex signals
- Follow the top economic events on FX Leaders economic calendar
- Trade better, discover more Forex Trading Strategies
- Open a FREE Trading Account
- Read our latest reviews on: Avatrade, Exness, HFM and XM
Related Articles


Sidebar rates
Related Posts
Ava

